Skip to content
Studia will be closed for Christmas and NYE.
Learn more
About
Academy
Close Academy
Open Academy
Studia School
Studia Tutoring
Studia Consultation
Ready to elevate your education?
Contact us
Workshop
Care
E-Shop
Resources
Blog
Home
About Us
Studia School
Studia Tutoring
Studia Consulting
Studia Workshop
Studia Shop
Care
Resources
Blog
Platform
Fe-mail
Fe-phone
Fe-map-pin
Fe-instagram
Platform
Back
IGCSE Edexcel
Mathematics A
6. Statistics & Probability
Mathematics A
IGCSE Edexcel
Revision Notes
6. Statistics & Probability
6.1 Graphical Representation of Data
>
6.2 Statistical Measures
>
6.3 Probability
>
1. Numbers & the Number System
1.1 Integers
>
1.2 Fractions
>
1.3 Decimals
>
1.4 Powers and Roots
>
1.5 Set Language and Notation
>
1.6 Percentages
>
1.7 Ratio and Proportion
>
1.8 Degree of Accuracy
>
1.9 Standard Form
>
1.10 Applying Numbers
>
1.11 Electronic Calculator
>
2. Equations, Formulae & Identities
2.1 Use of Symbols
>
2.2 Algebraic Manipulation
>
2.3 Expressions and Formulae
>
2.4 Linear Equations
>
2.5 Proportion (Higher Tier Only)
>
2.6 Simultaneous Linear Equations
>
2.7 Quadratic Equations
>
2.8 Inequalities
>
3. Sequences, Functions & Graphs
3.1 Sequences
>
3.2 Function Notation (Higher Tier Only)
>
3.3 Graphs
>
3.4 Calculus (Higher Tier Only)
>
4. Geometry
4.1 Angles, Lines and Triangles
>
4.2 Polygons
>
4.3 Symmetry
>
4.4 Measures
>
4.5 Construction
>
4.6 Circle Properties
>
4.7 Geometric Reasoning
>
4.8 Trigonometry and Pythagoras’ Theorem
>
4.9 Mensuration of 2D Shapes
>
4.10 3D Shapes and Volumes
>
4.11 Similarity
>
5. Vectors & Transformation Geometry
5.1 Vectors (Higher Tier Only)
>
5.2 Transformation Geometry
>
7. Appendix
7.1 Appendix 1: Foundation Tier Formula Sheet (Given)
>
7.2 Appendix 2: Foundation Tier Formula Sheet (To Memorise)
>
7.3 Appendix 3: Higher Tier Formula Sheet (Given)
>
7.4 Appendix 4: Higher Tier Formula Sheet (To Memorise)
>
7.5 Appendix 5: Notation
>
6.2 Statistical Measures
6.2.1 Understand the concept of average
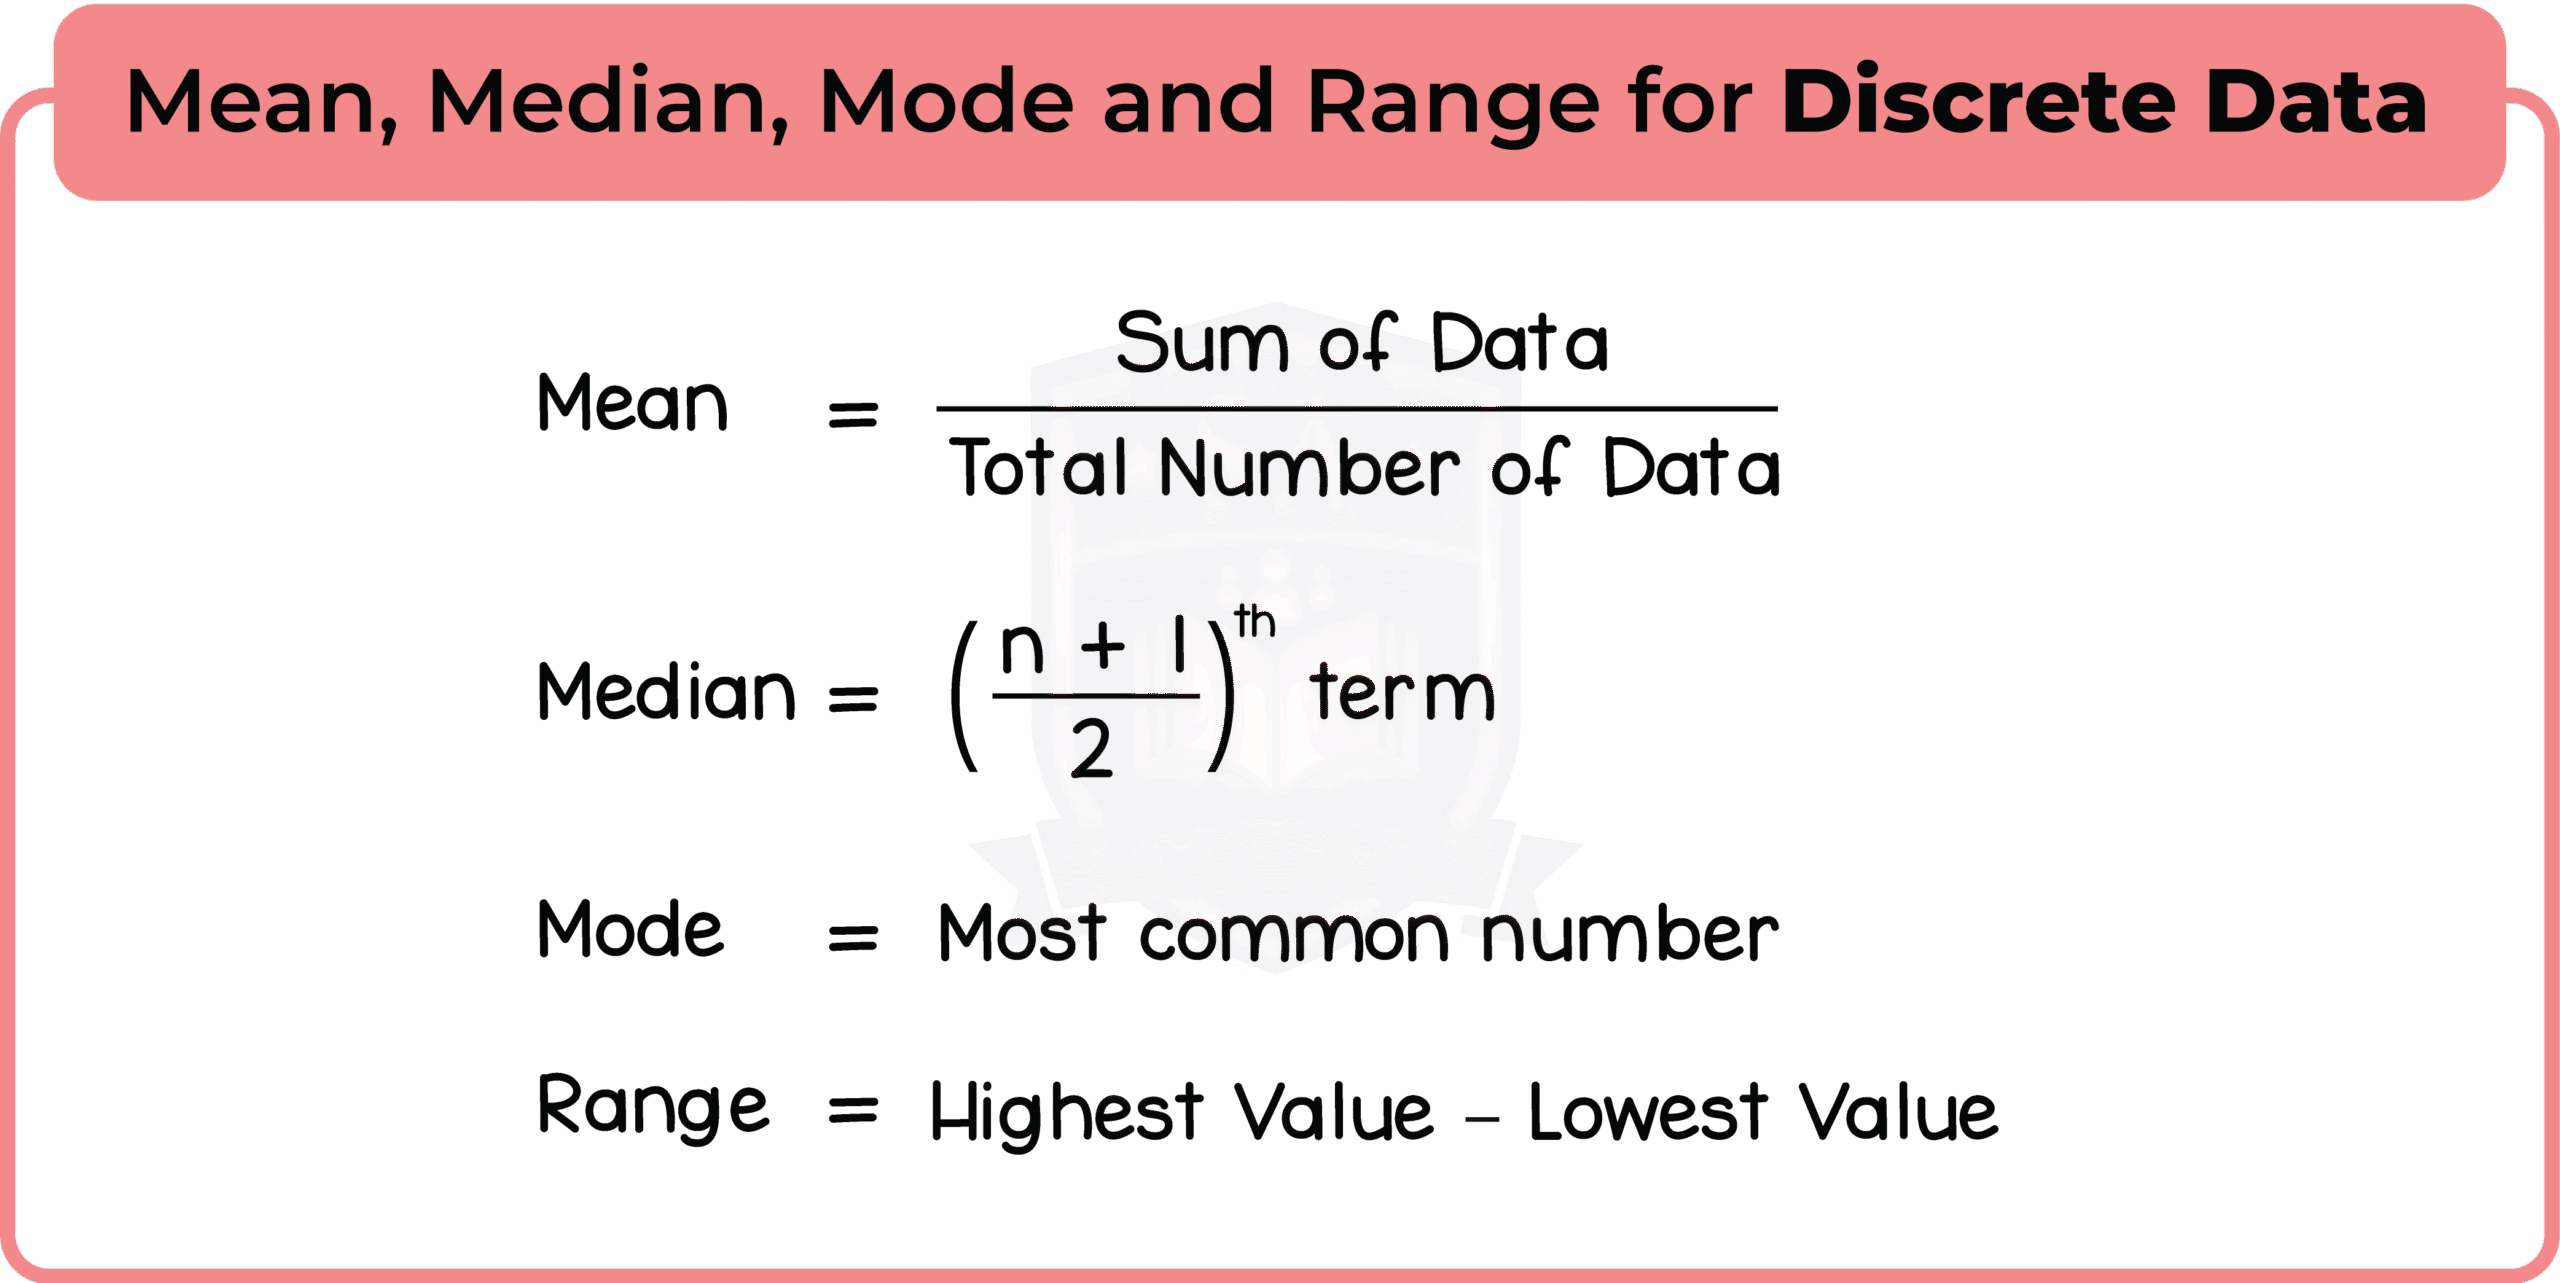
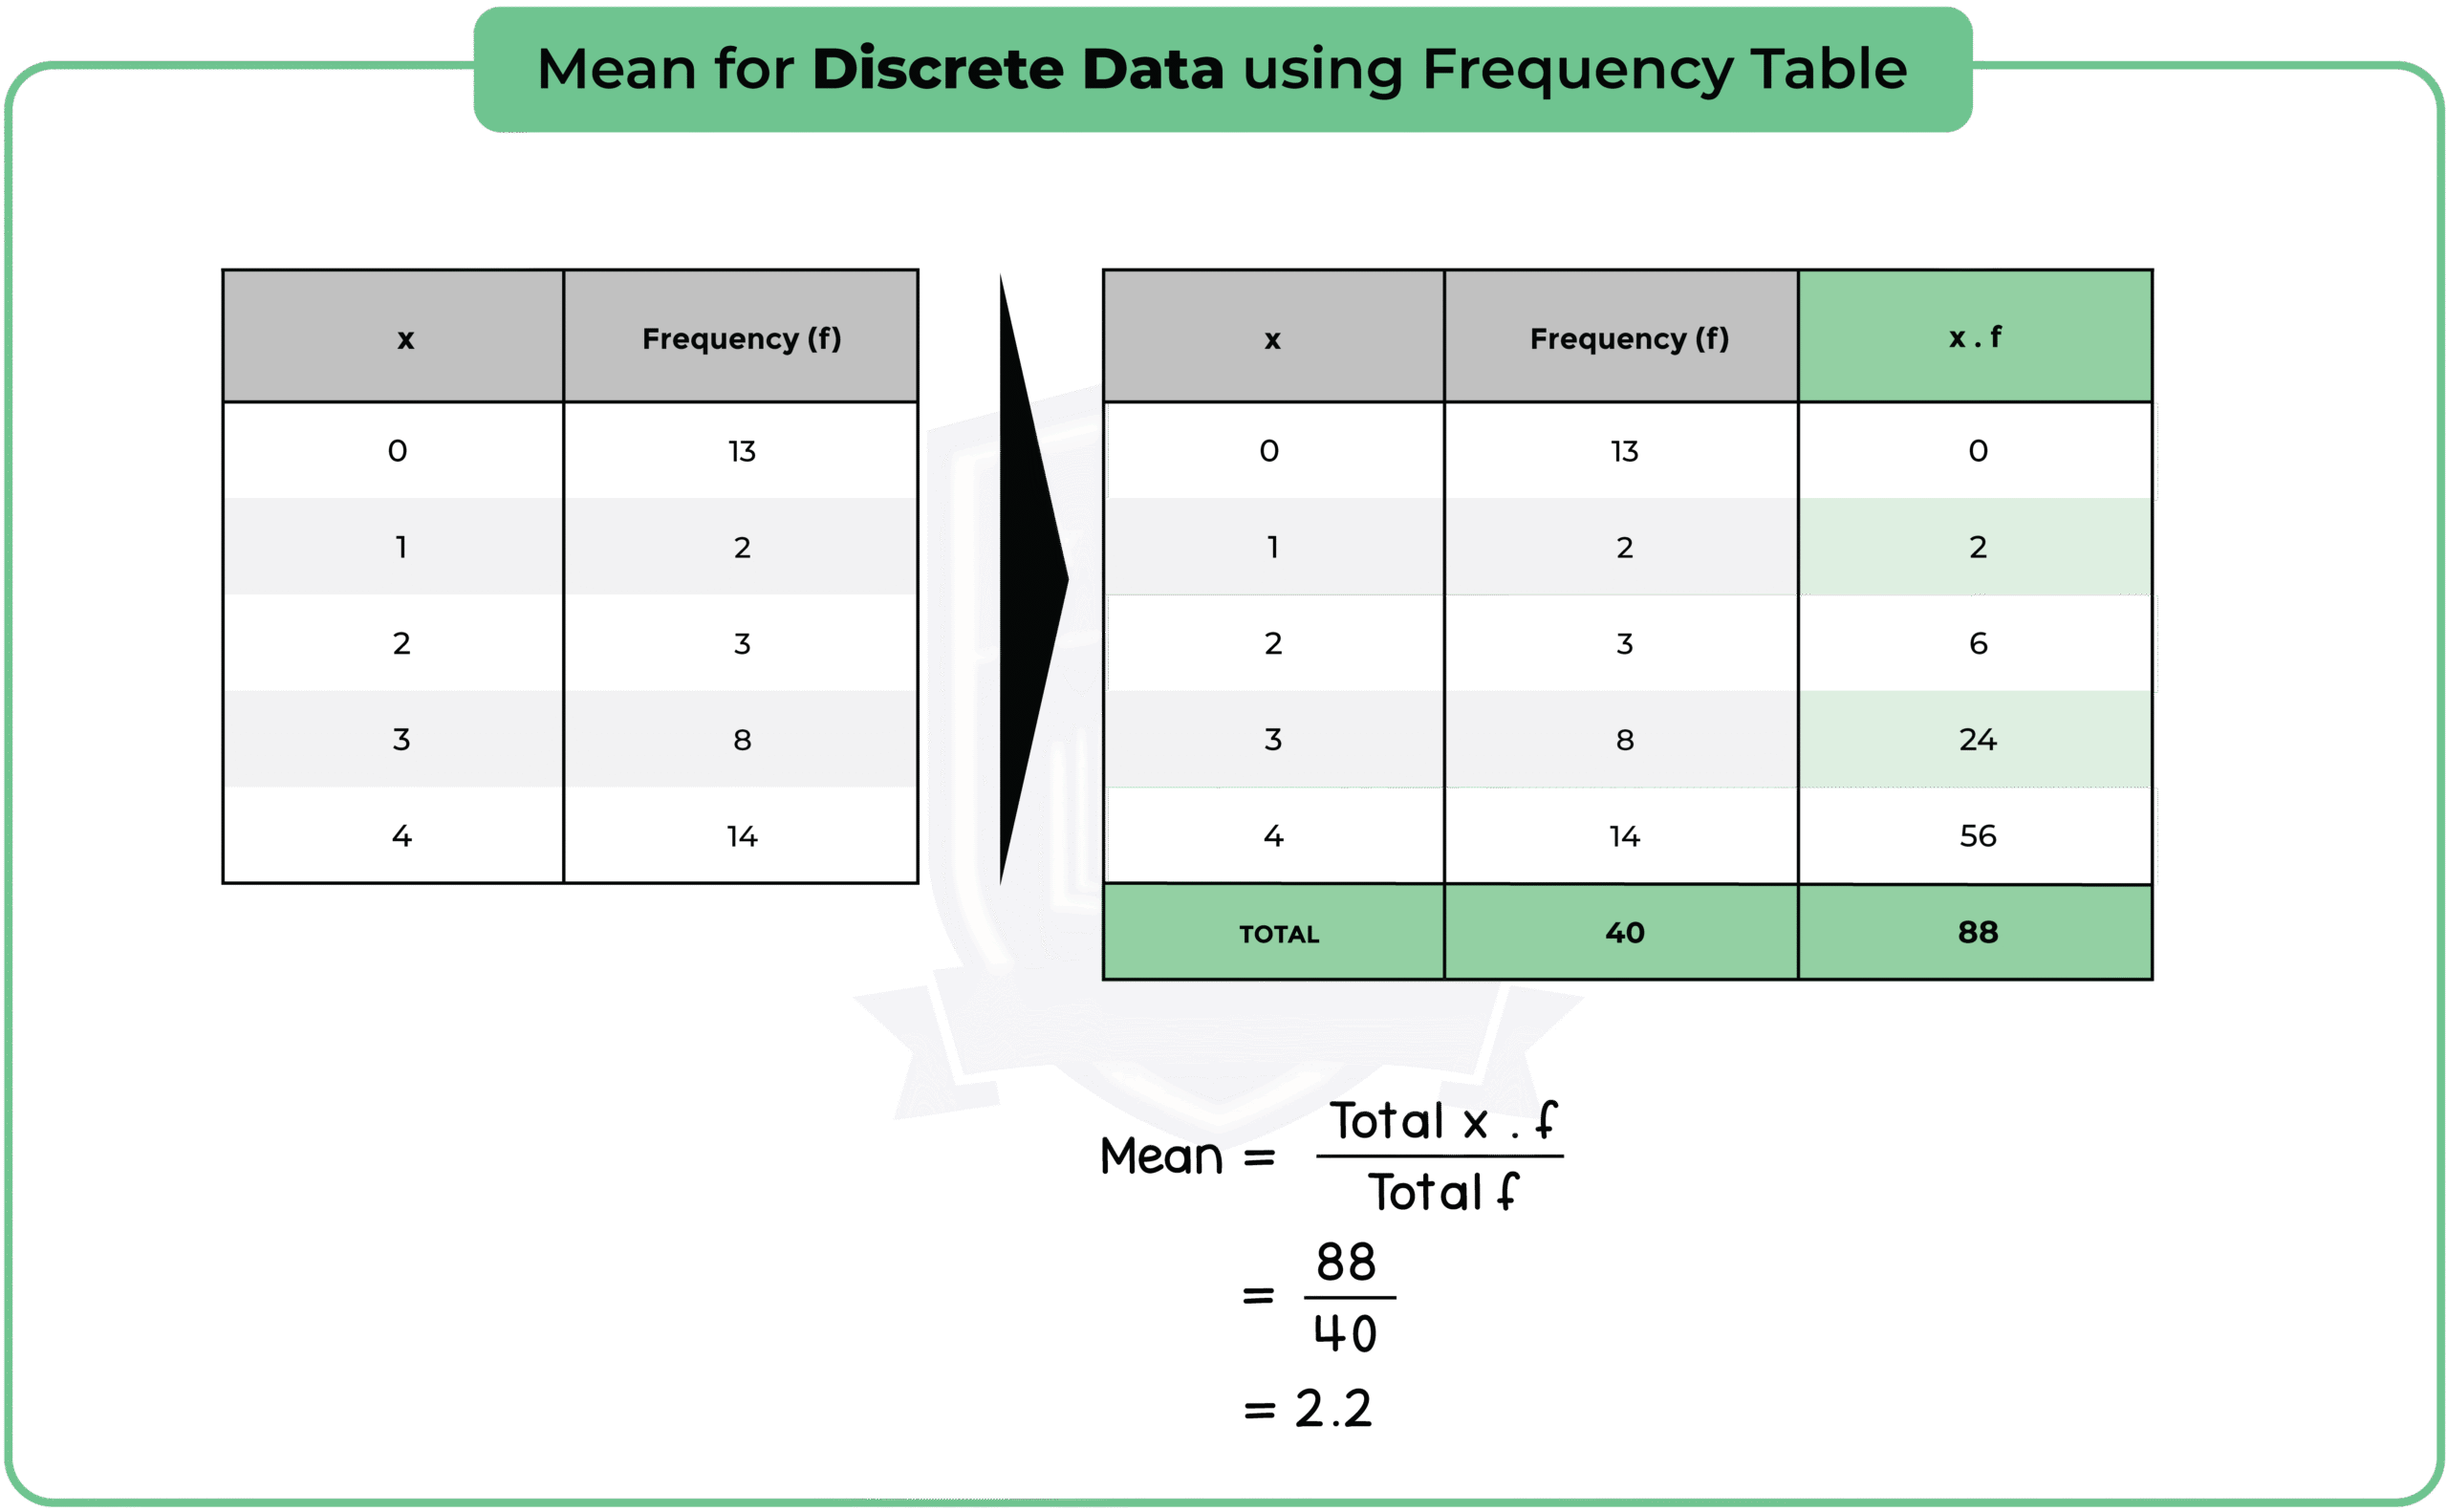
6.2.2 Calculate the mean, median, mode and range for a discrete data set
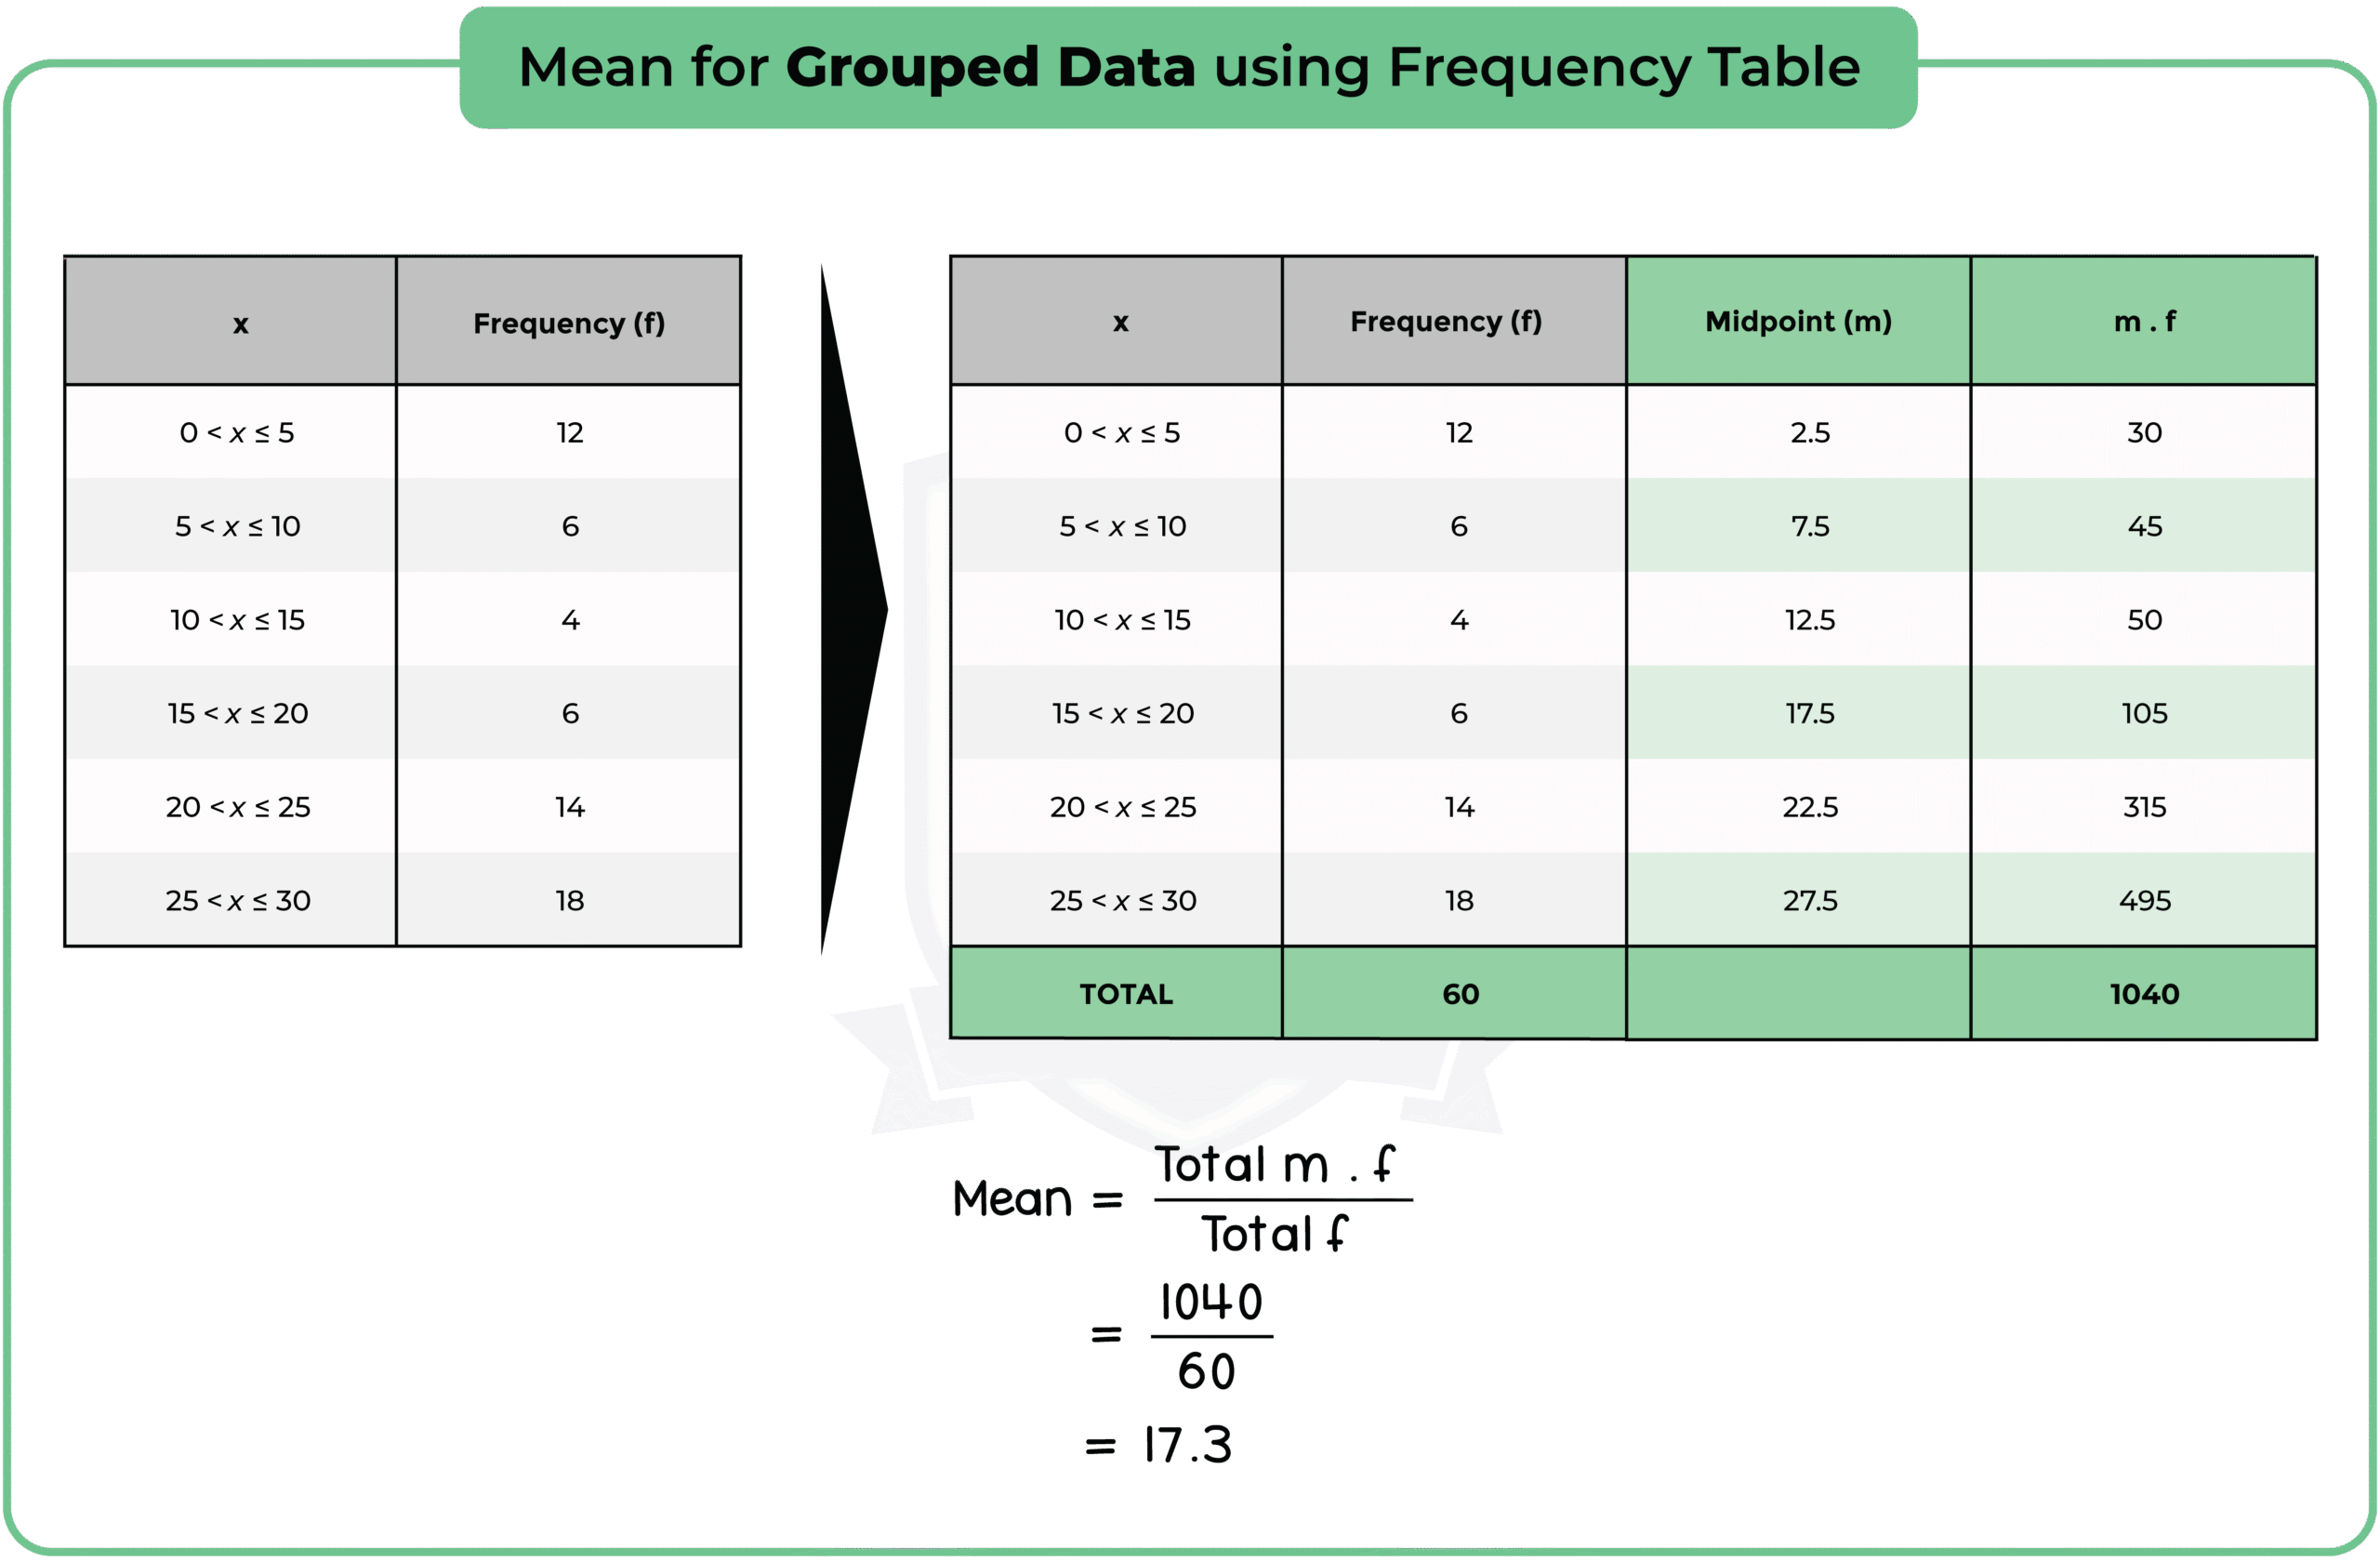
6.2.3 Calculate an estimate for the mean for grouped data
6.2.4 Identify the modal class for grouped data
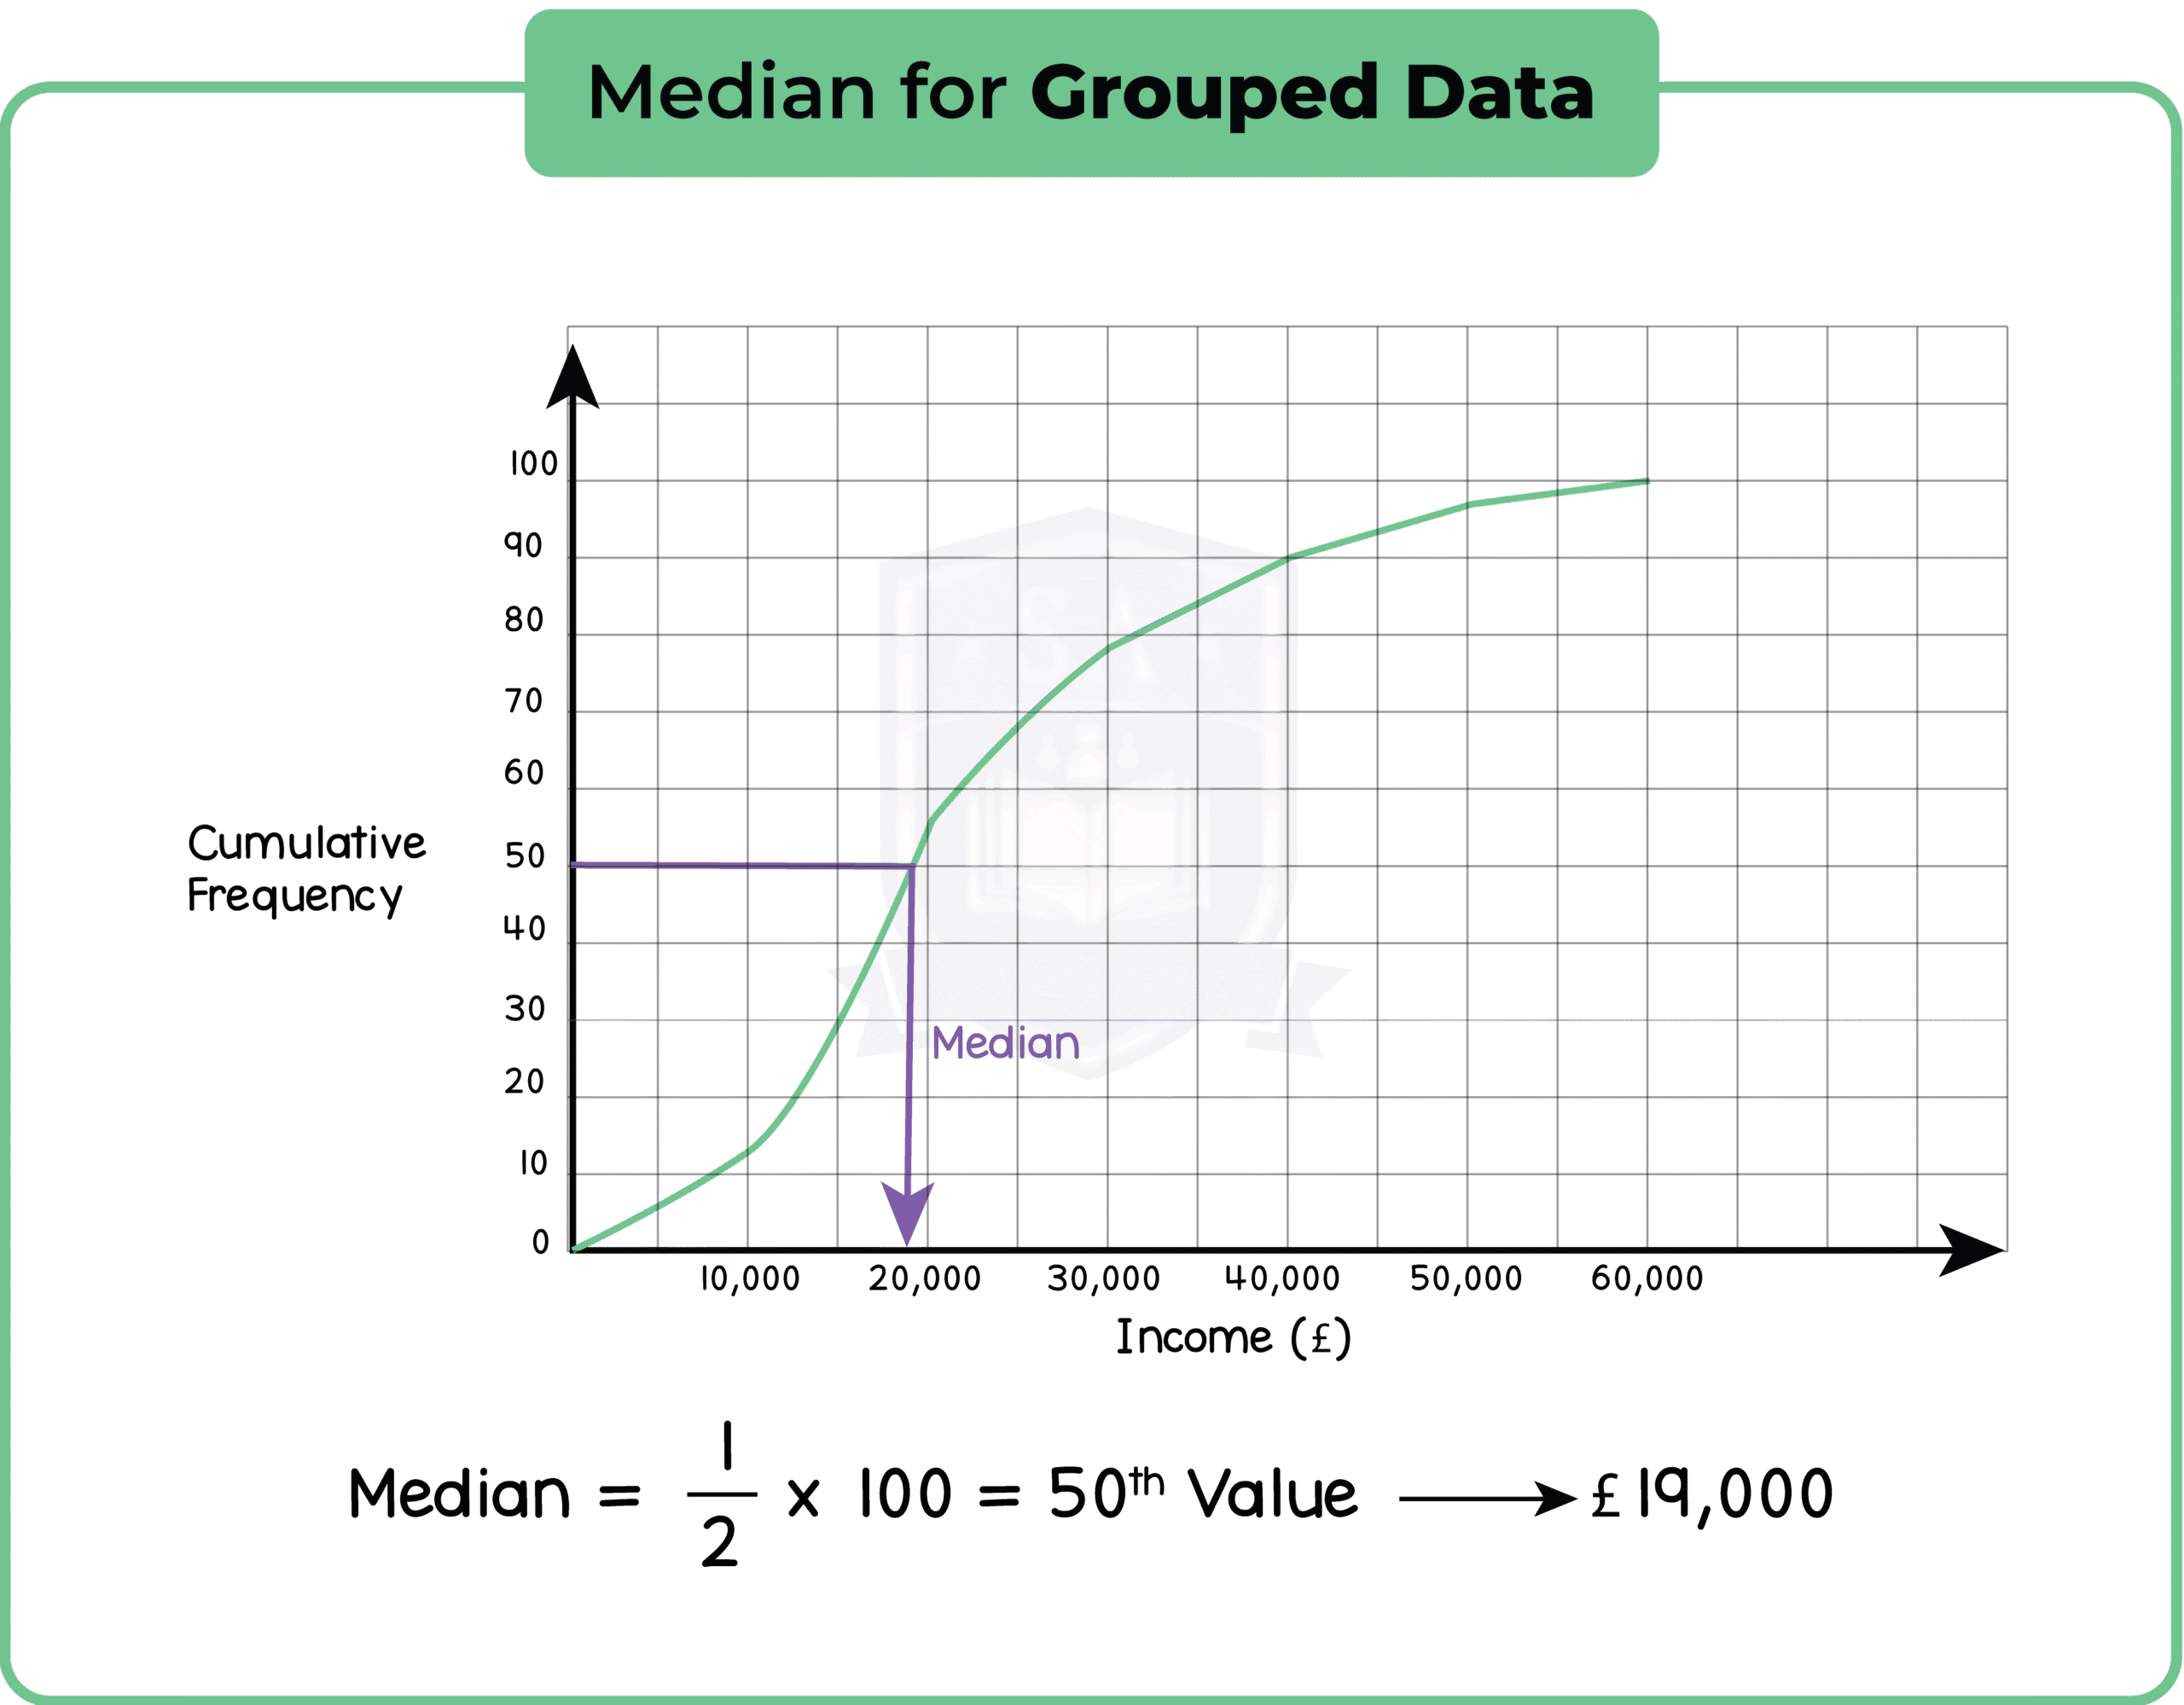
6.2.5 Estimate the median from a cumulative frequency diagram (Higher Tier Only)
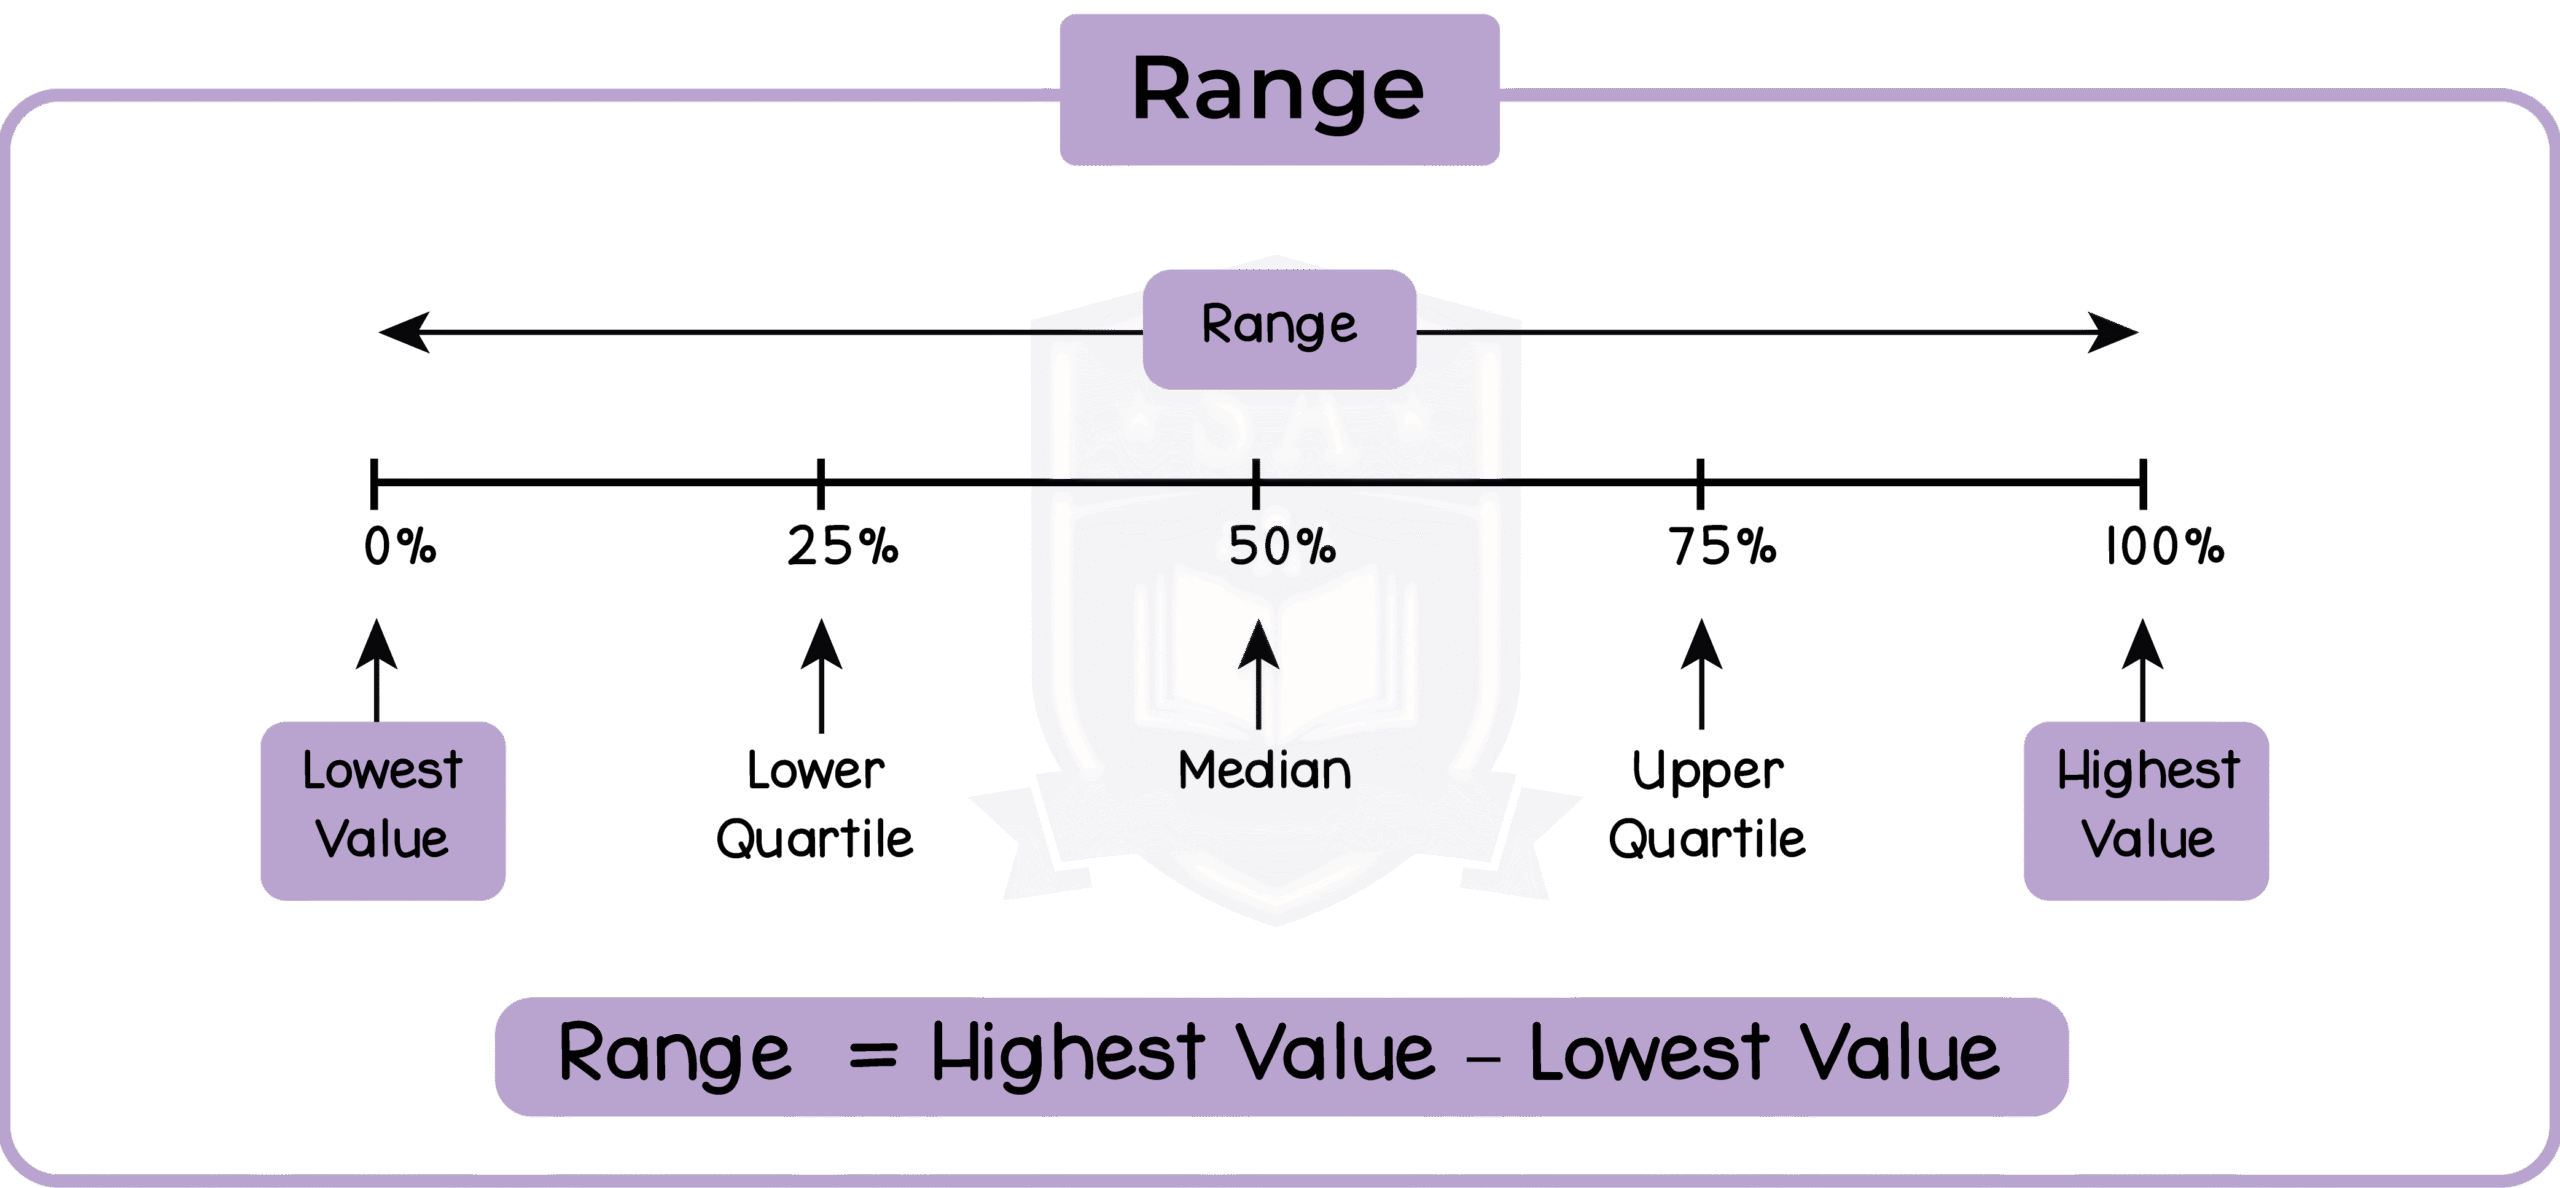
6.2.6 Understand the concept of a measure of spread (Higher Tier Only)
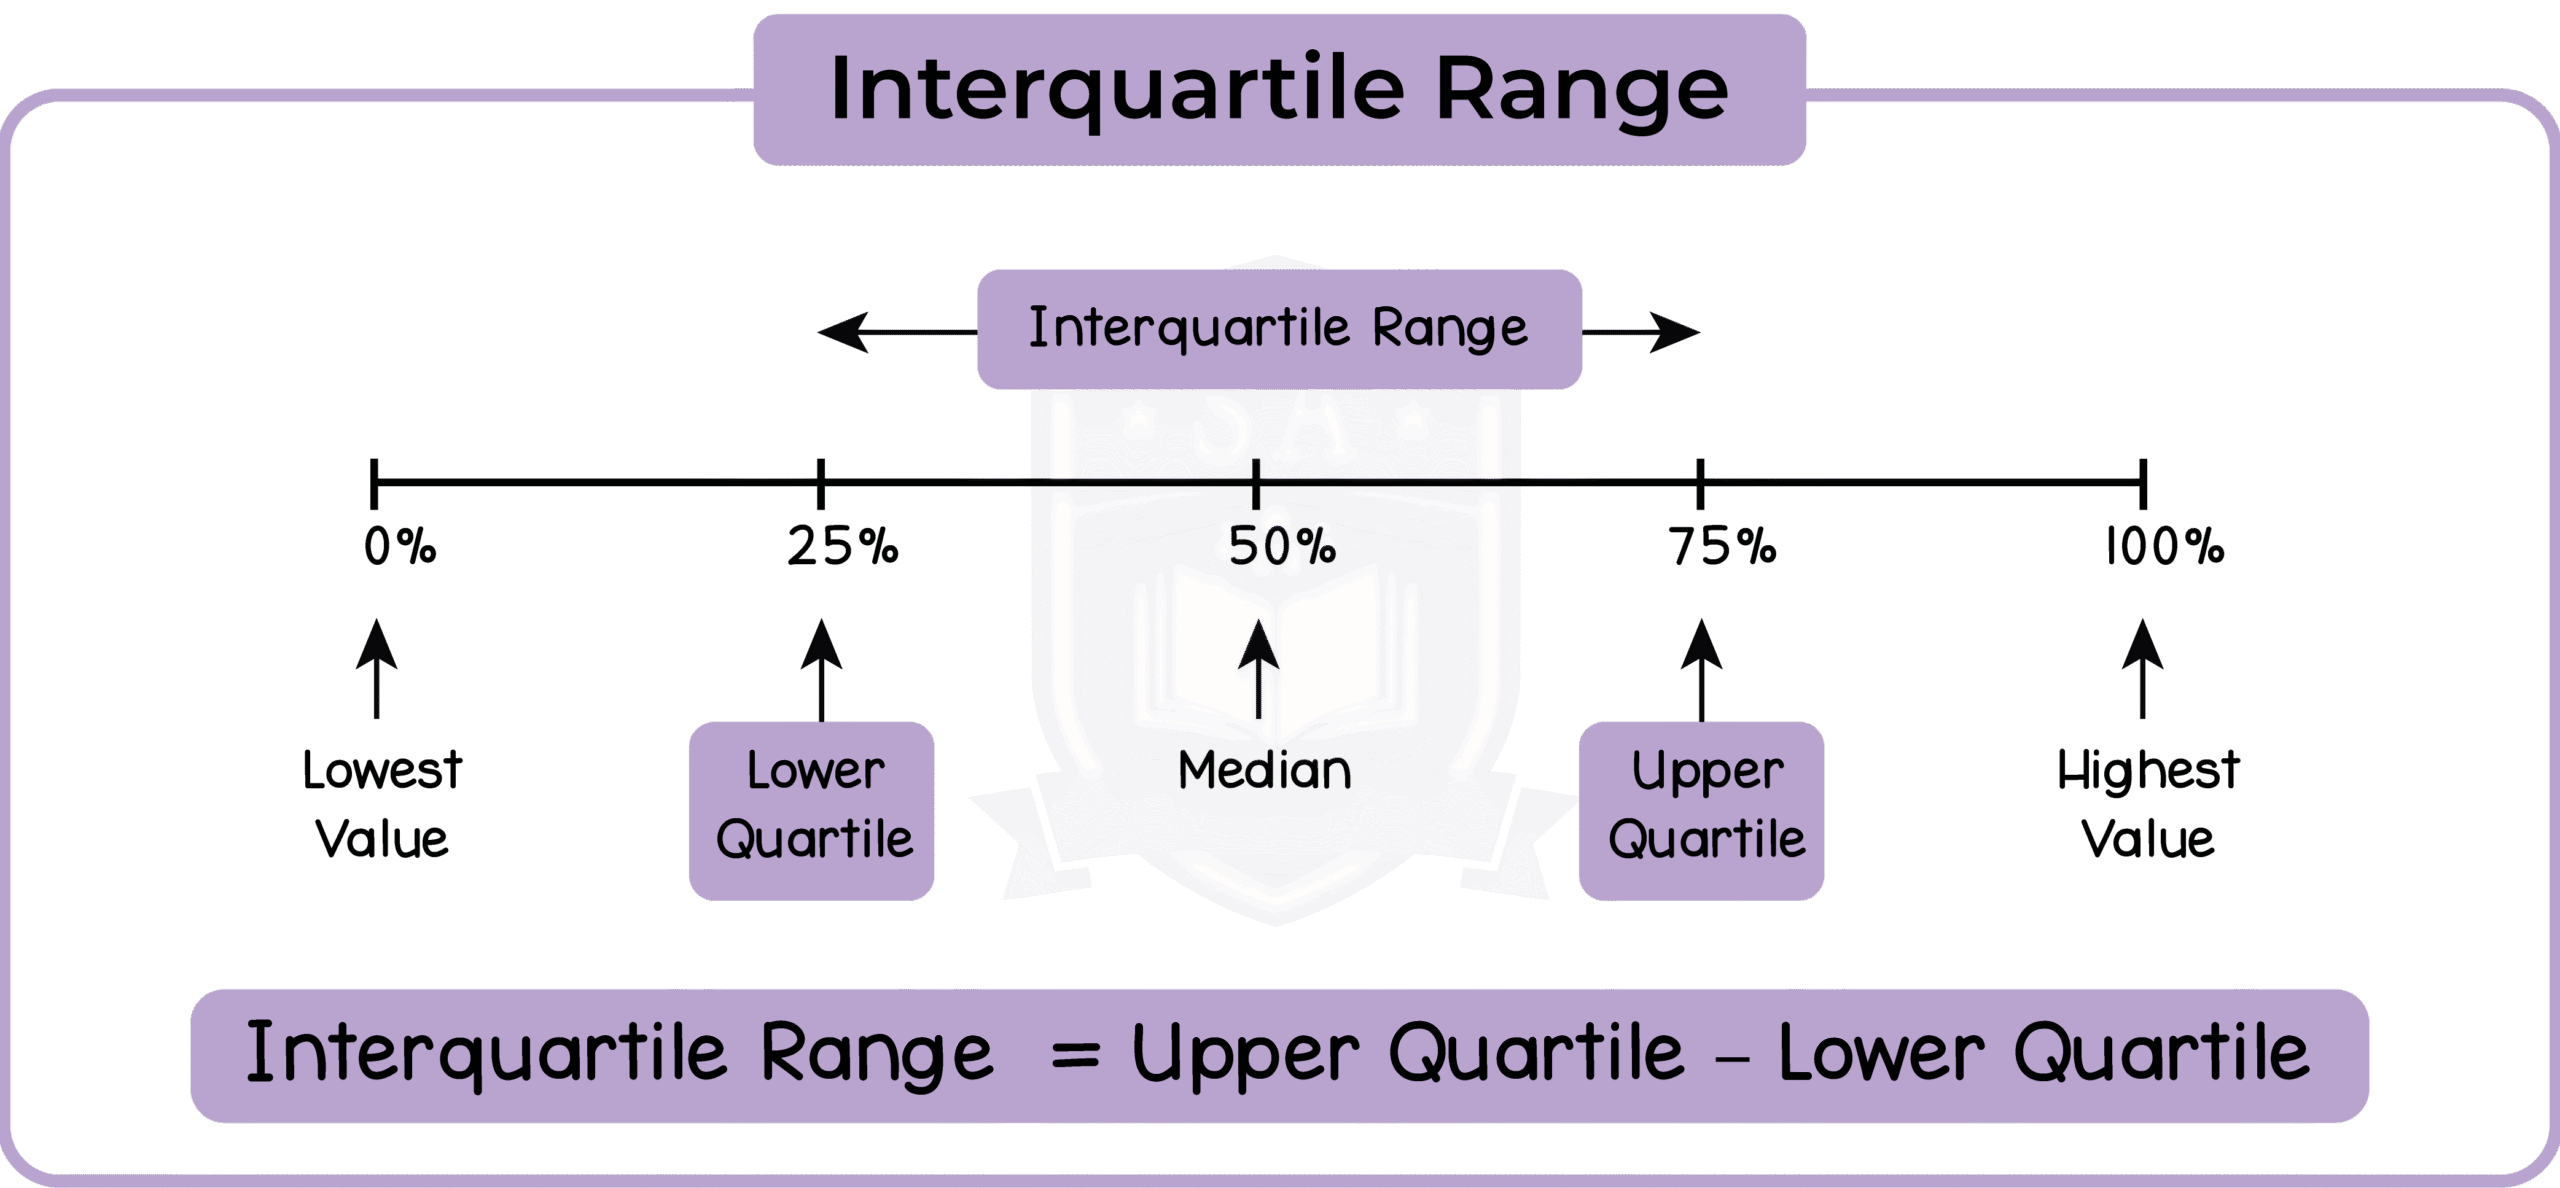
6.2.7 Find the interquartile range from a discrete data set (Higher Tier Only)
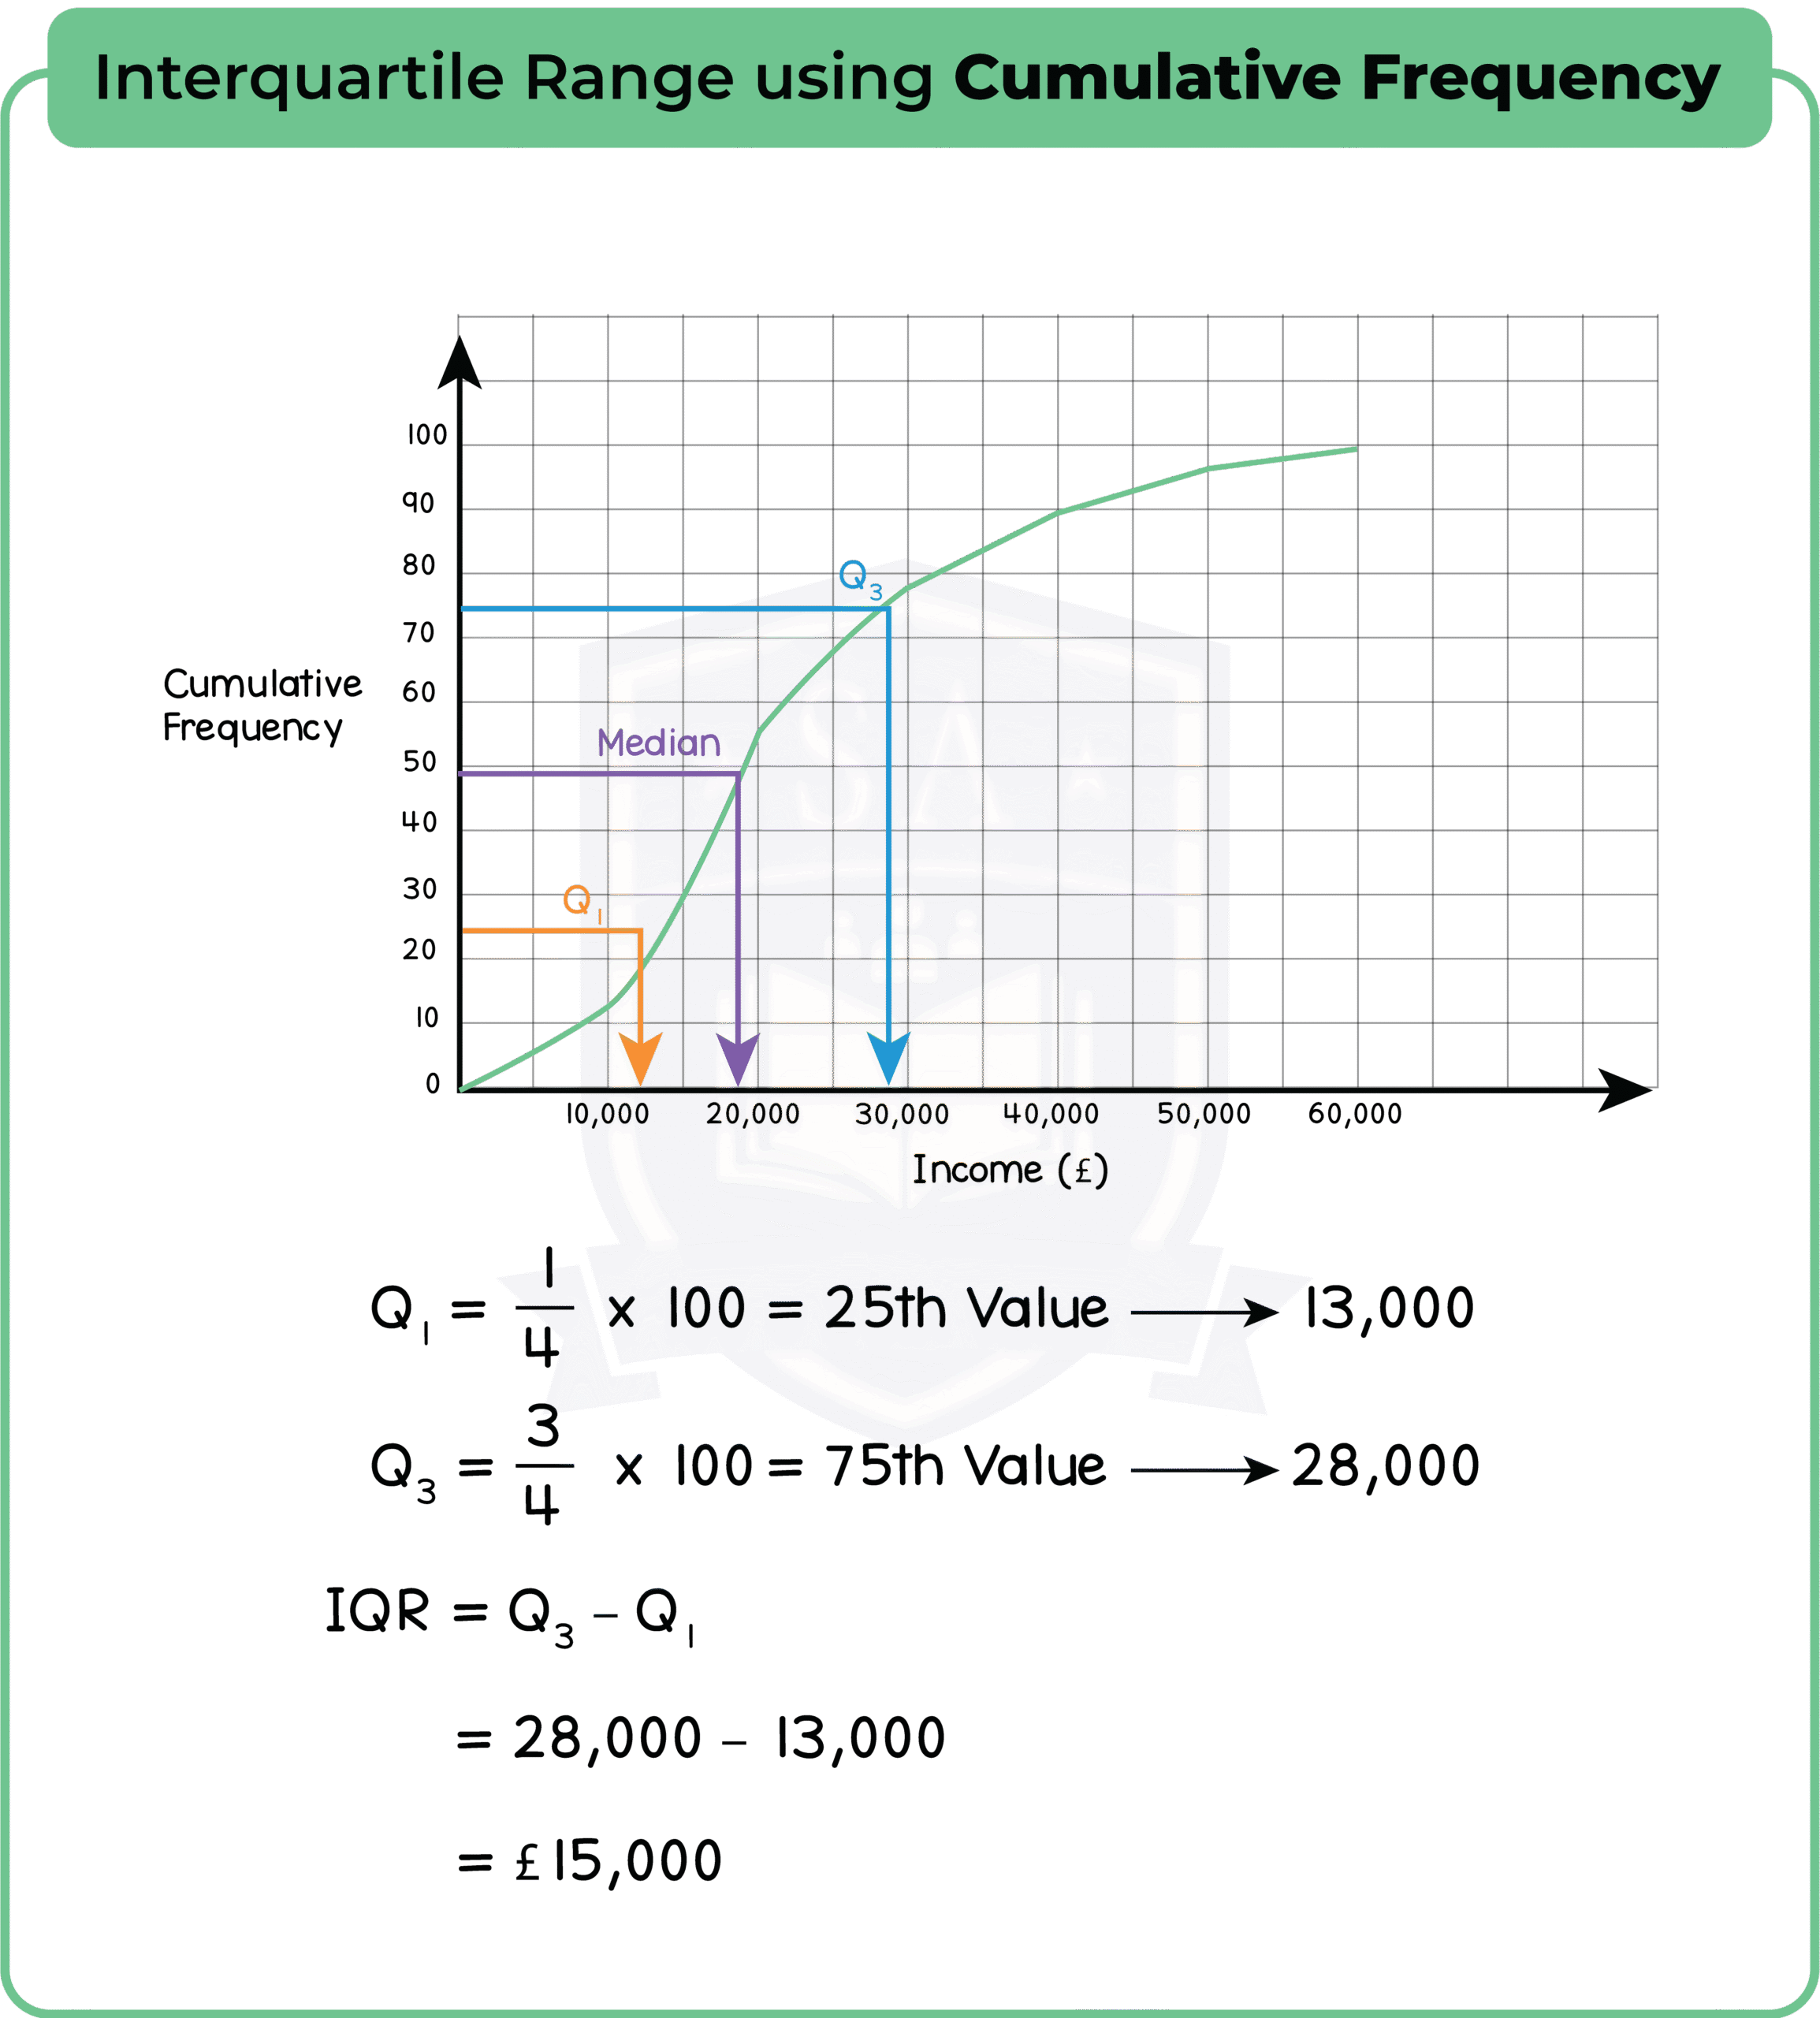
6.2.8 Estimate the interquartile range from a cumulative frequency diagram (Higher Tier Only)
Previous
6.1 Graphical Representation of Data
Next
6.3 Probability
Contact Studia
Please fill out the form below, and we’ll get back to you as soon as possible.
Name
Email
Phone
Subject
General Inquiry
Studia School
Studia Tutoring
Studia Consultation
Studia Workshop
Studia Care
Studia Space
Join Studia
Message
Send