Skip to content
Studia will be closed for Christmas and NYE.
Learn more
  • About
  • Academy
    • Studia School
    • Studia Tutoring
    • Studia Consultation
    Ready to elevate your education?
    Contact us
  • Workshop
  • Care
  • E-Shop
  • Resources
  • Blog
  • Home
  • About
  • Studia School
  • Studia Tutoring
  • Studia Consultation
  • Studia Workshop
  • Studia Care
  • Shop
  • Resources
  • Blog
Platform
Fe-mail Fe-phone Fe-map-pin Fe-instagram
Platform
Back
  • IGCSE Edexcel
  • Mathematics A
  • 6. Statistics & Probability

Mathematics A

  • IGCSE Edexcel
  • Revision Notes

6. Statistics & Probability


6.1 Graphical Representation of Data>6.2 Statistical Measures>6.3 Probability>

1. Numbers & the Number System

1.1 Integers >1.2 Fractions >1.3 Decimals >1.4 Powers and Roots >1.5 Set Language and Notation >1.6 Percentages >1.7 Ratio and Proportion >1.8 Degree of Accuracy >1.9 Standard Form >1.10 Applying Numbers >1.11 Electronic Calculator >

2. Equations, Formulae & Identities

2.1 Use of Symbols >2.2 Algebraic Manipulation >2.3 Expressions and Formulae >2.4 Linear Equations >2.5 Proportion (Higher Tier Only) >2.6 Simultaneous Linear Equations >2.7 Quadratic Equations >2.8 Inequalities >

3. Sequences, Functions & Graphs

3.1 Sequences >3.2 Function Notation (Higher Tier Only) >3.3 Graphs >3.4 Calculus (Higher Tier Only) >

4. Geometry

4.1 Angles, Lines and Triangles >4.2 Polygons >4.3 Symmetry >4.4 Measures >4.5 Construction >4.6 Circle Properties >4.7 Geometric Reasoning >4.8 Trigonometry and Pythagoras’ Theorem >4.9 Mensuration of 2D Shapes >4.10 3D Shapes and Volumes >4.11 Similarity >

5. Vectors & Transformation Geometry

5.1 Vectors (Higher Tier Only) >5.2 Transformation Geometry >

7. Appendix

7.1 Appendix 1: Foundation Tier Formula Sheet (Given) >7.2 Appendix 2: Foundation Tier Formula Sheet (To Memorise) >7.3 Appendix 3: Higher Tier Formula Sheet (Given) >7.4 Appendix 4: Higher Tier Formula Sheet (To Memorise) >7.5 Appendix 5: Notation >

6.1 Graphical Representation of Data

6.1.1 Use different methods of presenting data

Types of Data

1) Discrete data takes an exact value.

For example: Age

Presentation of Data: Stem-and-leaf, Frequency Table

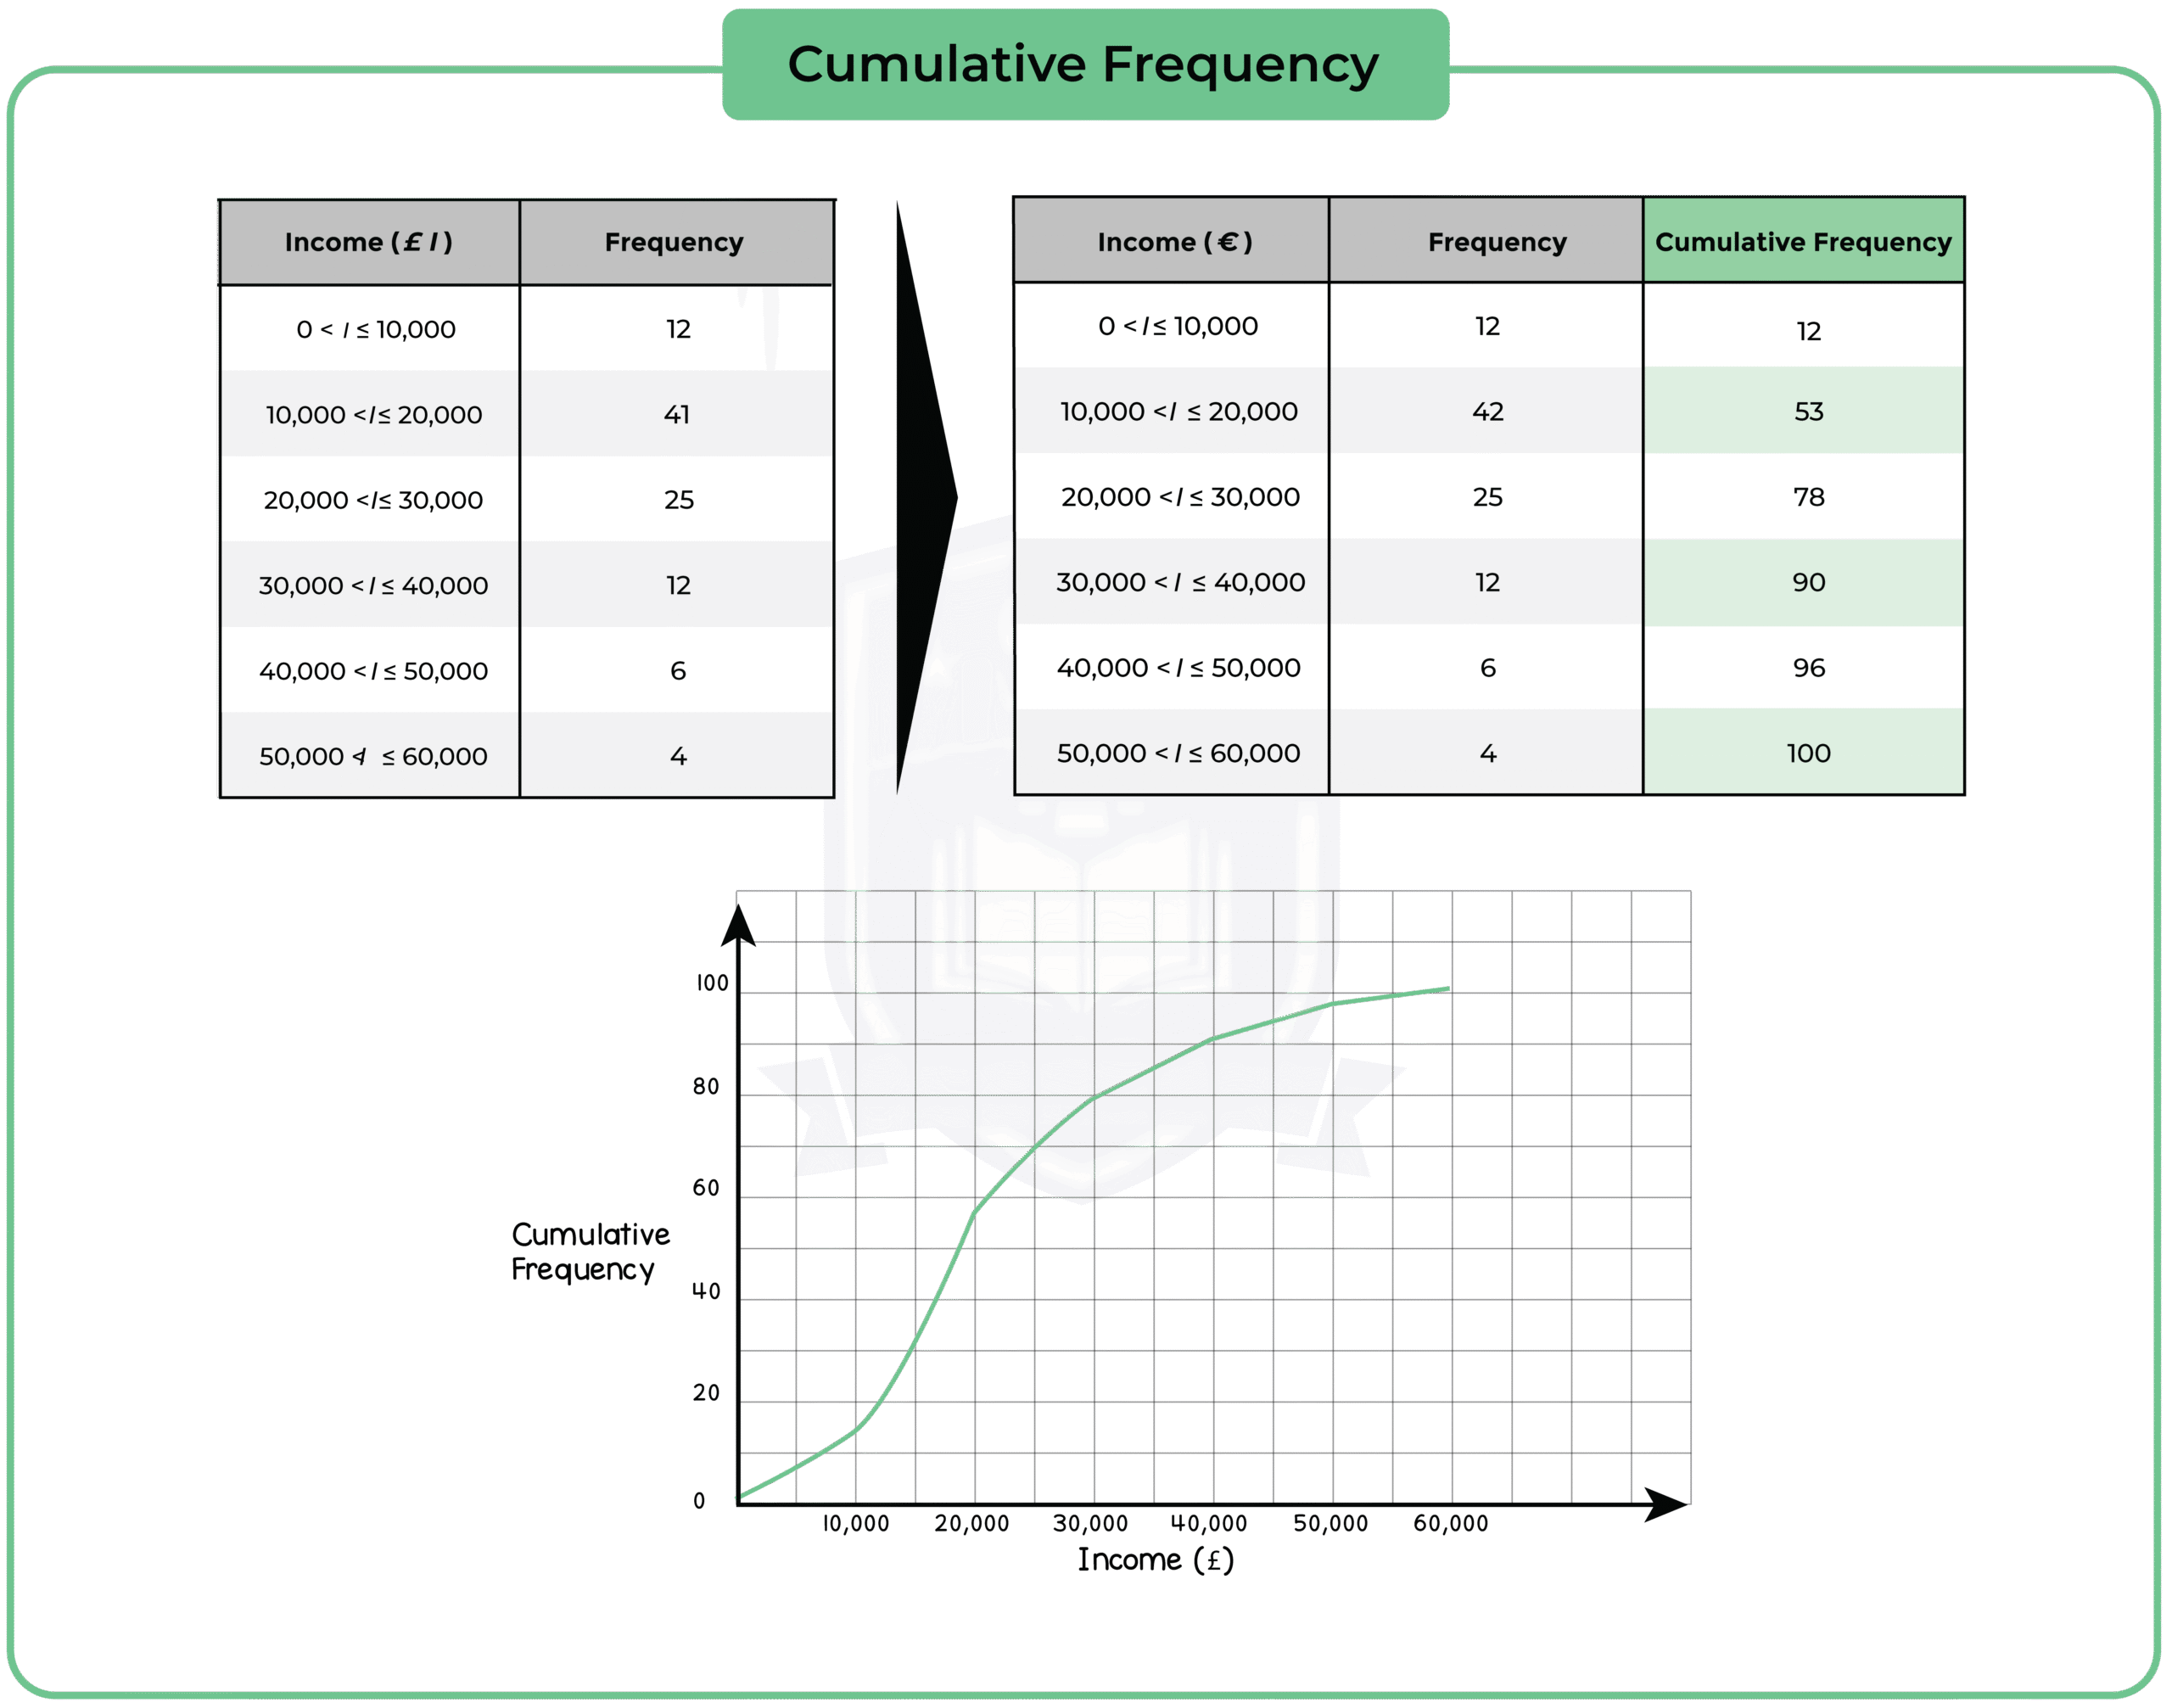
Statistical Diagram: Histogram, Cumultaive Frequency

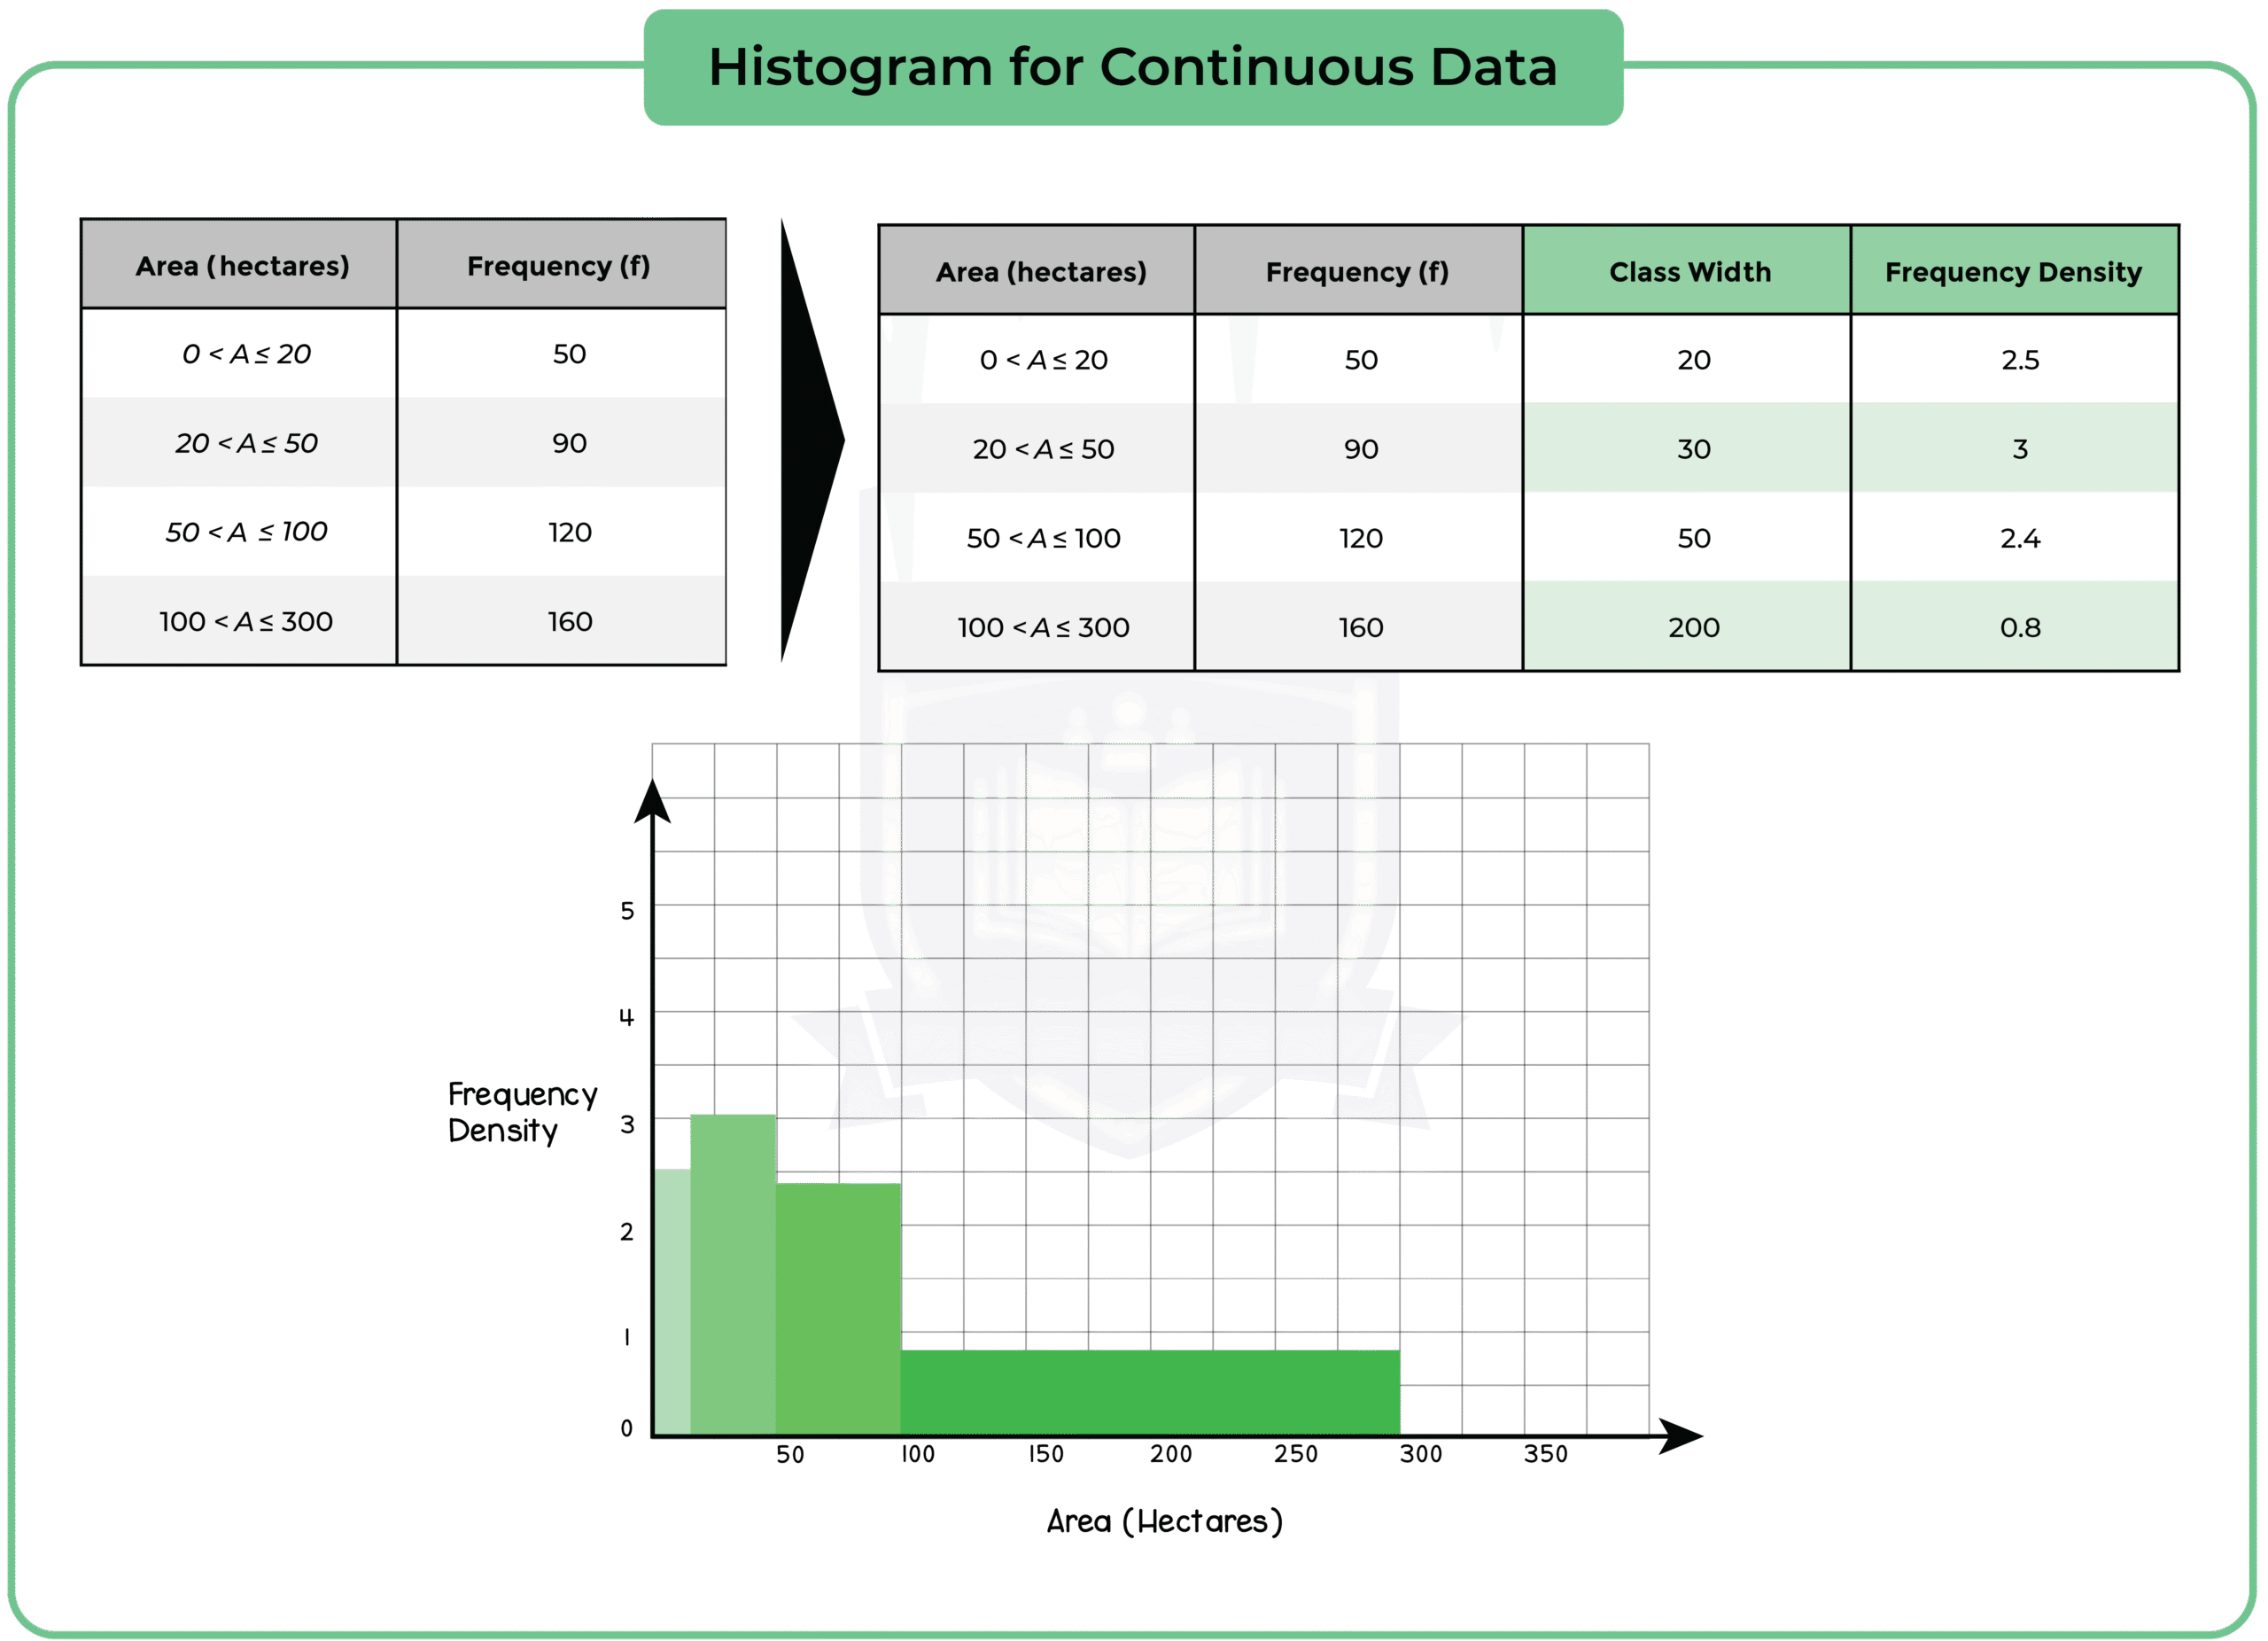
2) Continuous data takes a range of values.

For example: Height

Presentation of Data: Frequency Table

6.1.2 Use appropriate methods of tabulation to enable the construction of statistical diagrams

6.1.3 Interpret statistical diagrams

6.1.4 Construct and interpret histograms (Higher Tier Only)

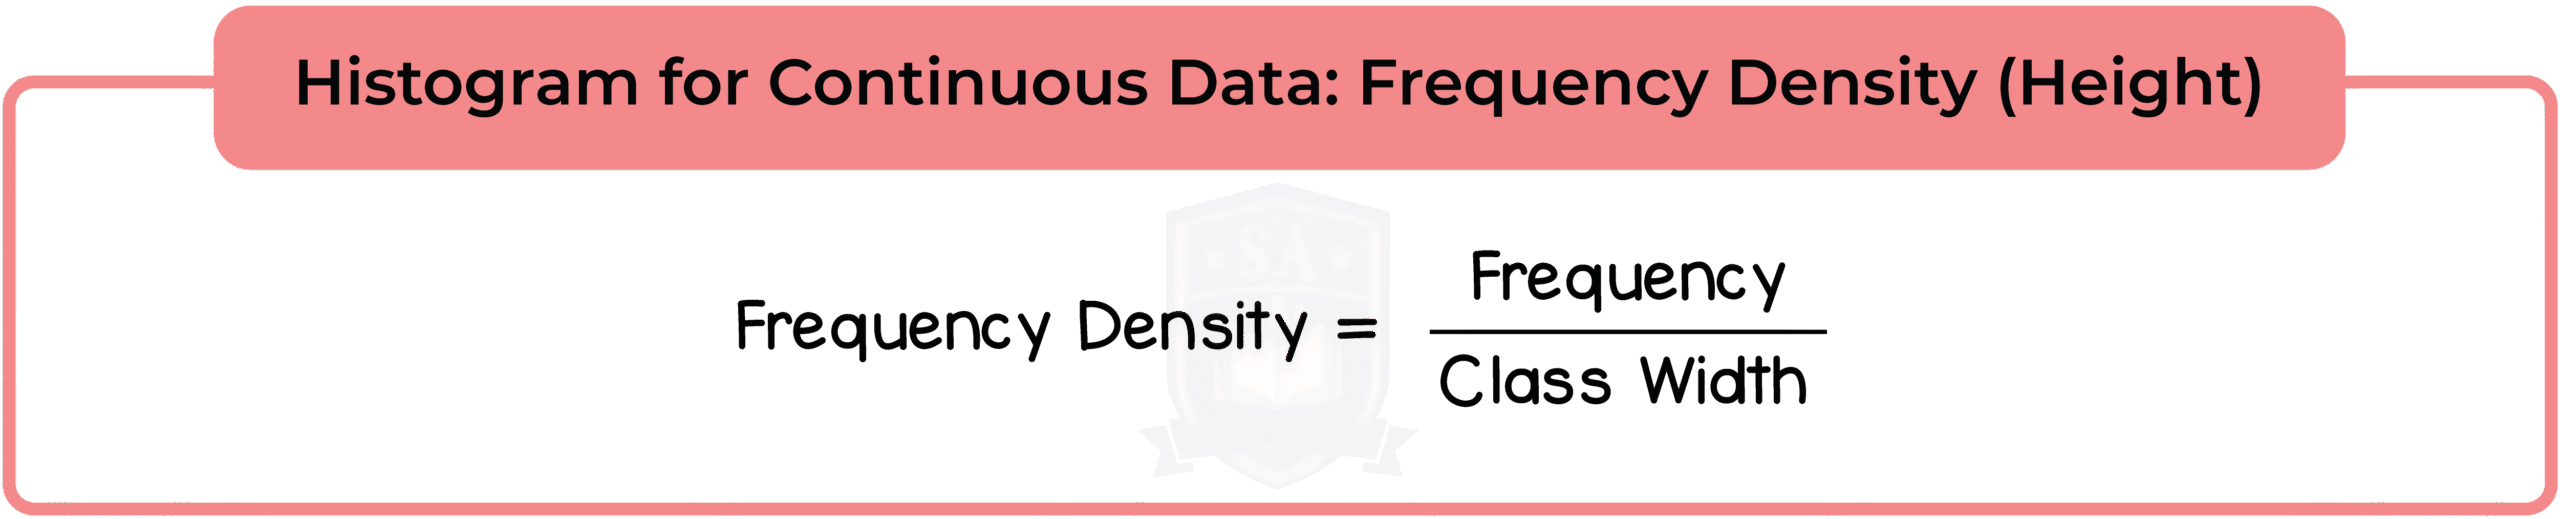
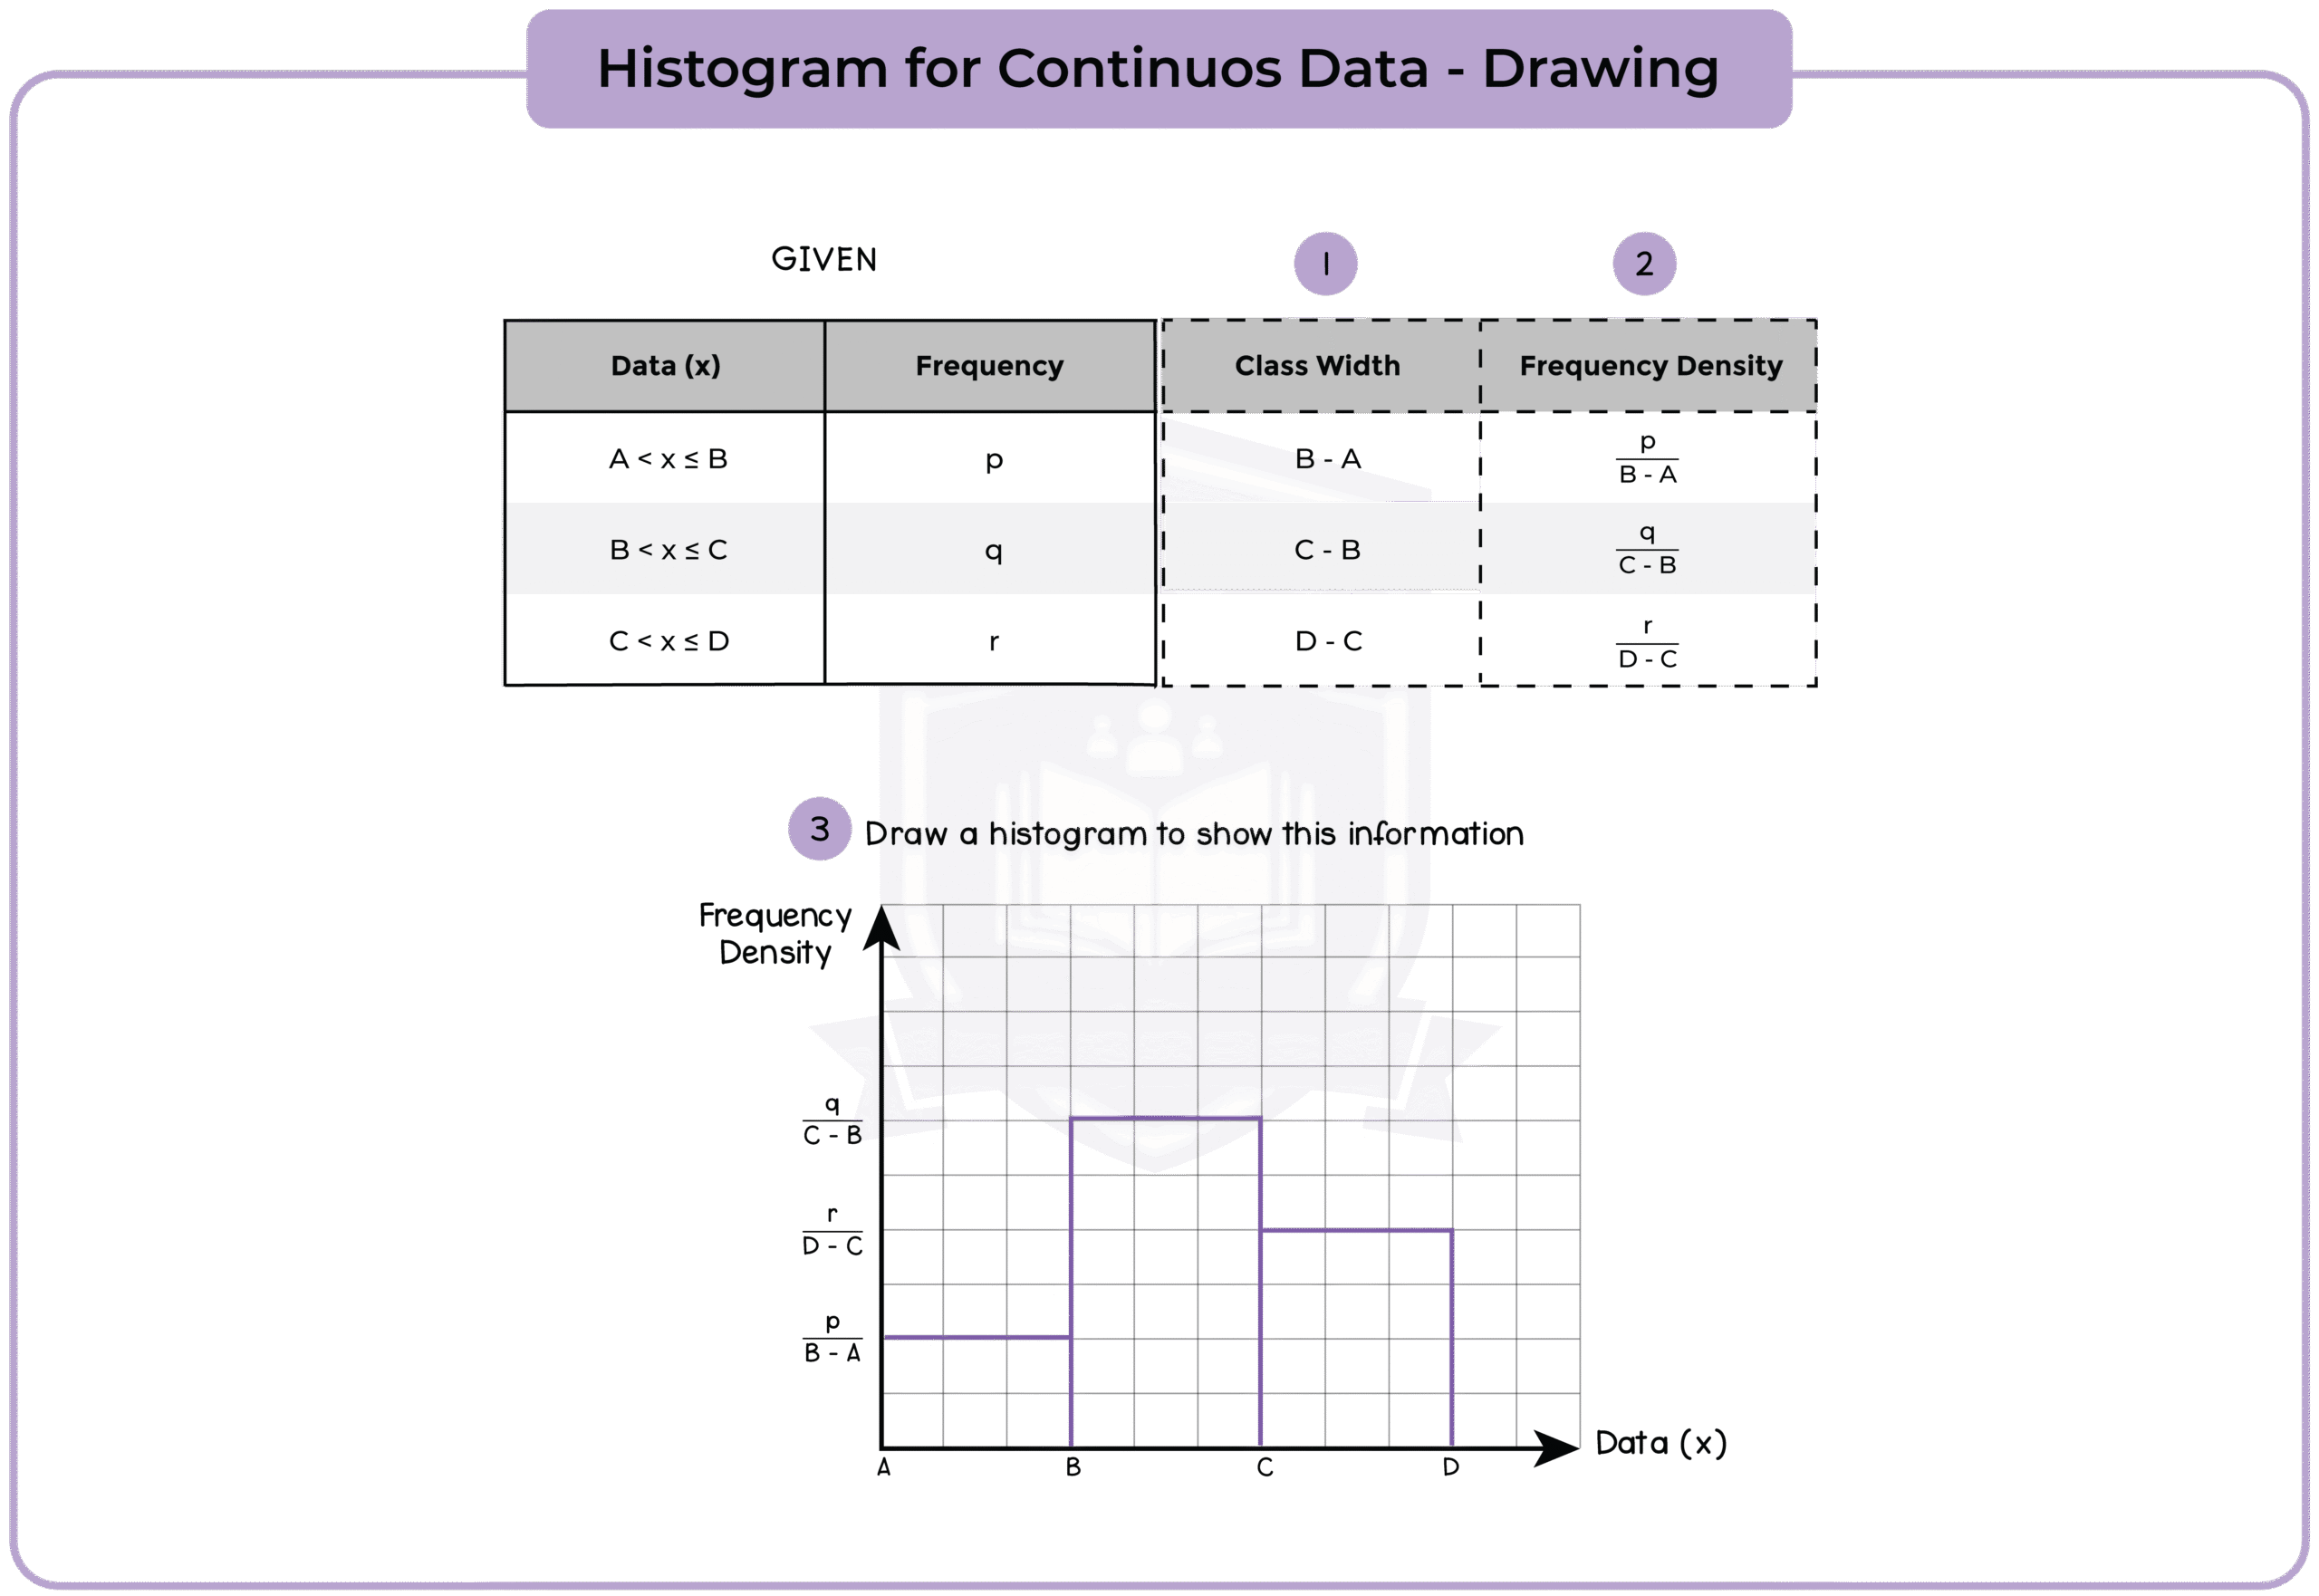
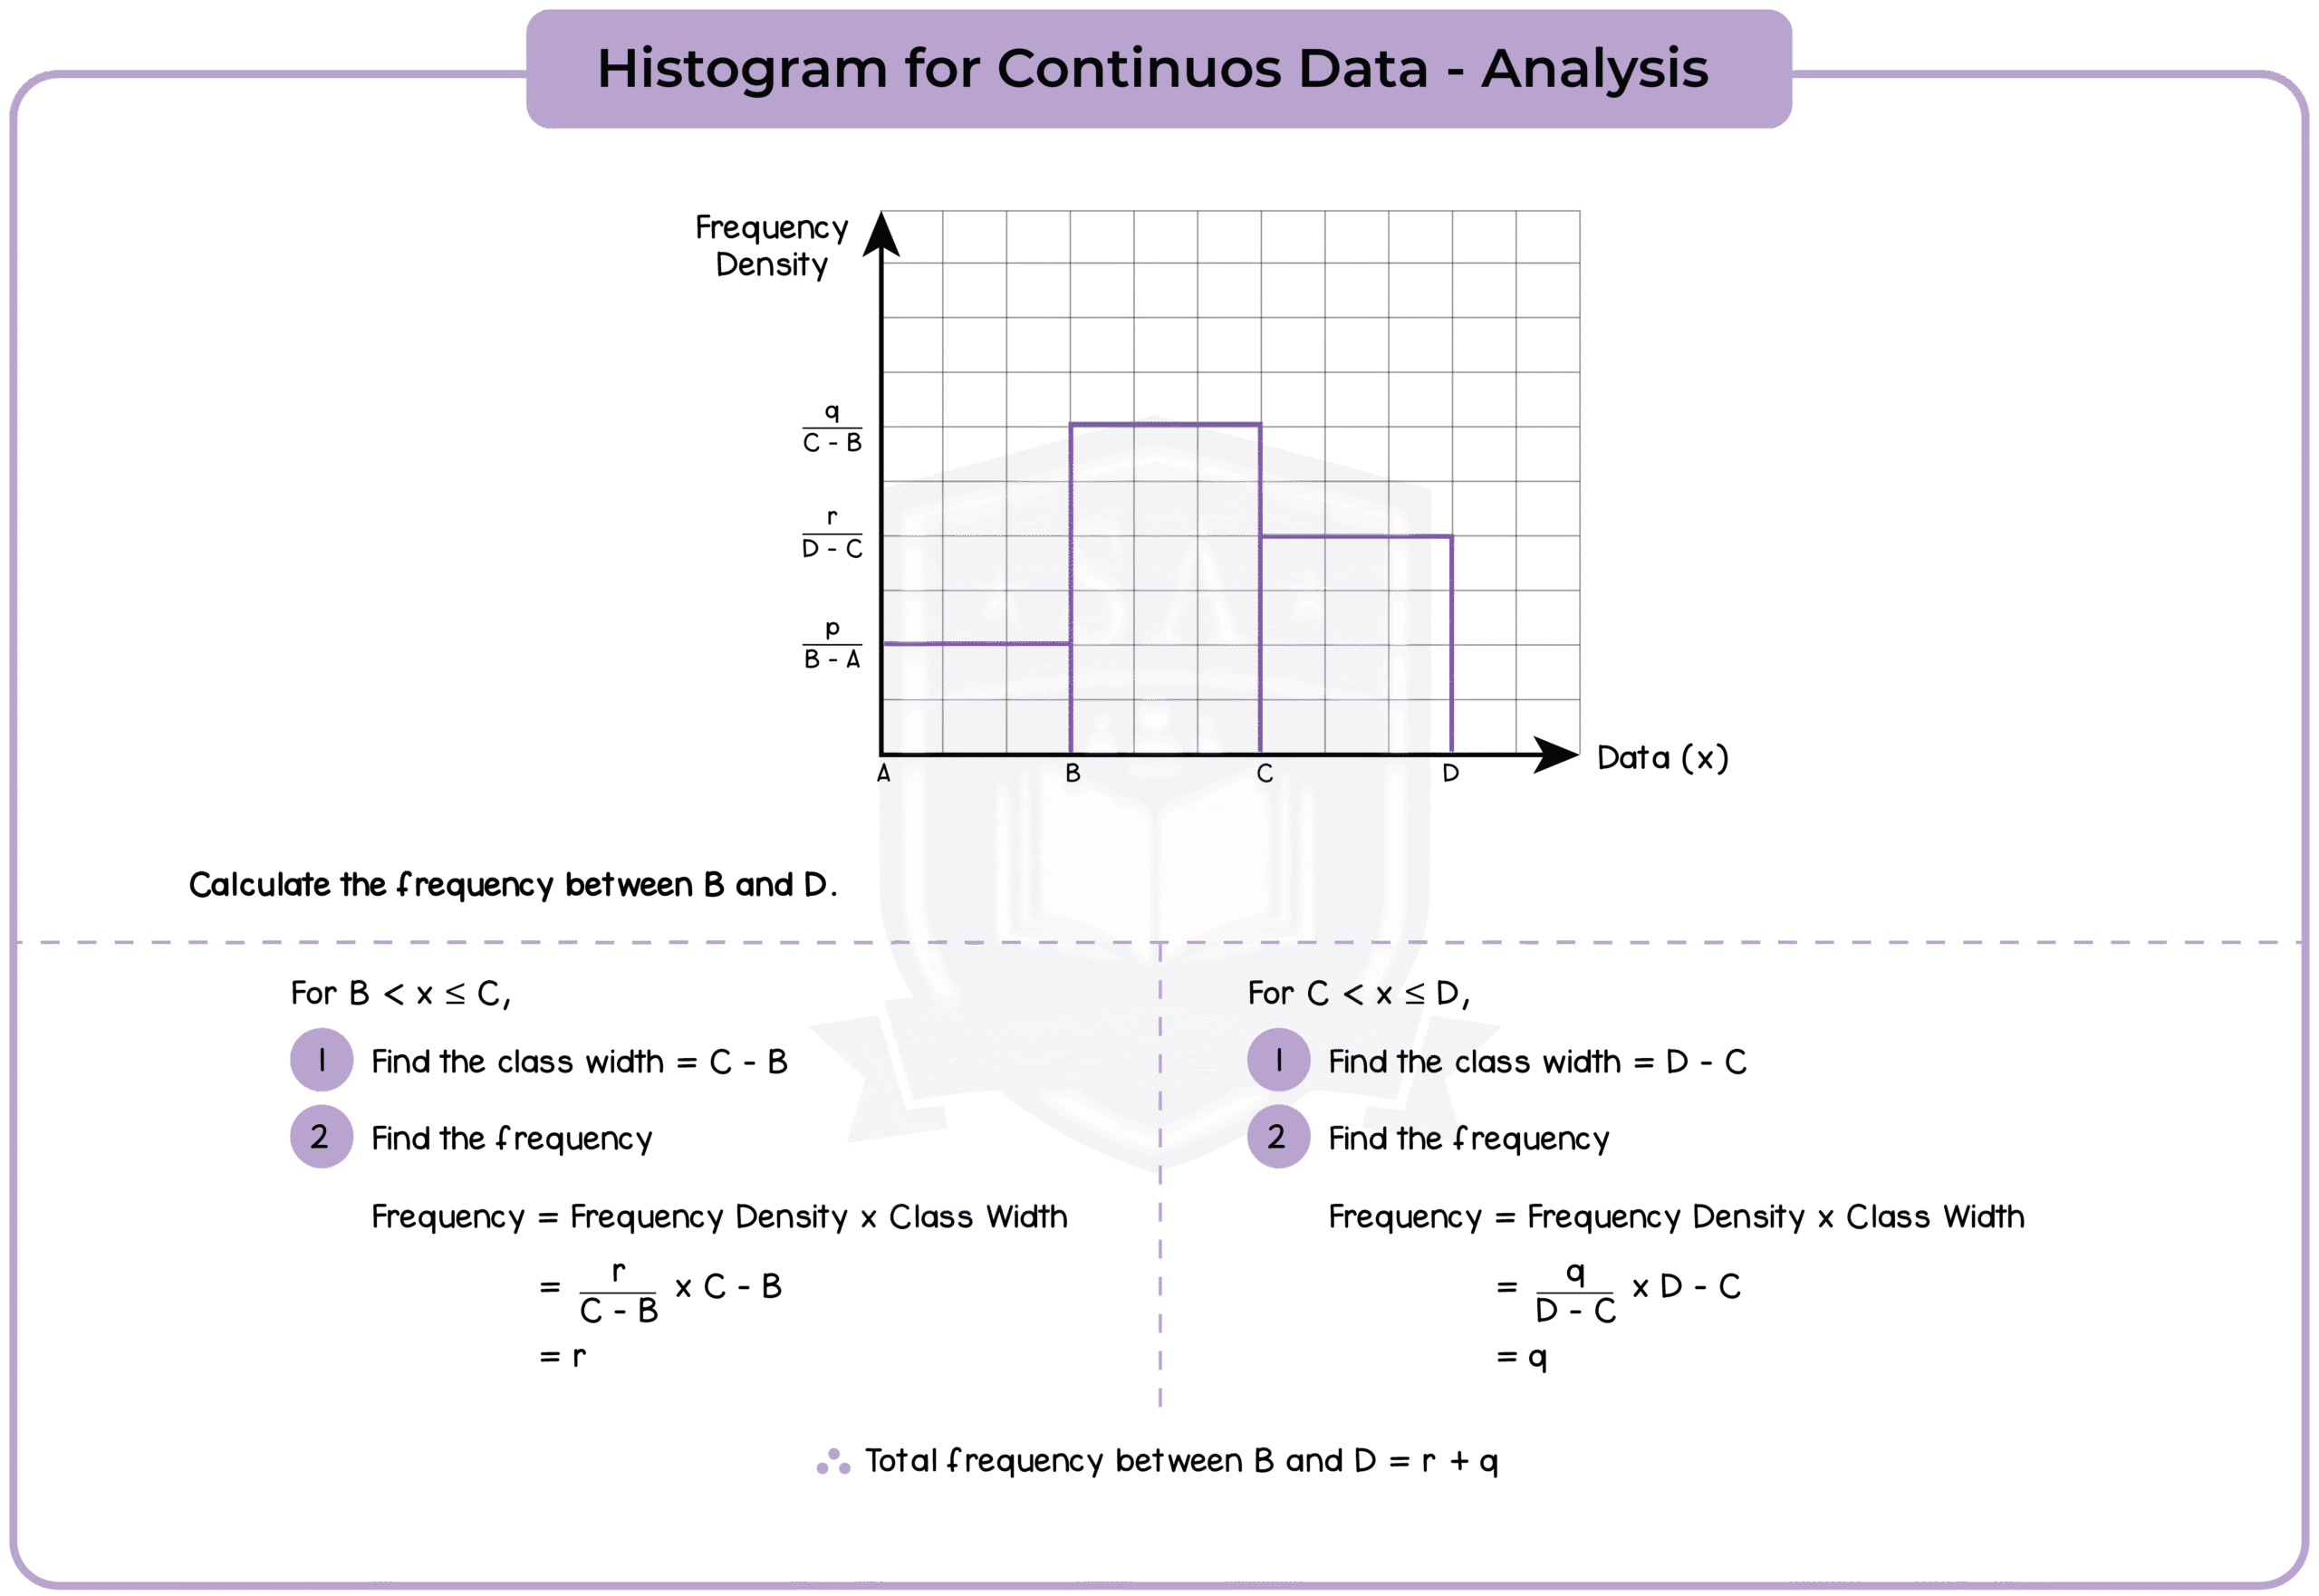
A histogram uses rectangle to represent each group (or class) interval.

  • The rectangles should touch, with no gaps between them.
  • Frequency = Frequency density (height) x Group width

6.1.5 Construct cumulative frequency diagrams from tabulated data (Higher Tier Only)

6.1.6 Use cumulative frequency diagrams (Higher Tier Only)

Previous5.2 Transformation Geometry
Next6.2 Statistical Measures

Start Your Success Story Today

  • enquiries@studiaacademy.com
  • (+852) 5487 8448
  • 1201B, Tower 1, Admiralty Center,

    18 Harcourt Road, Admiralty, Hong Kong
  • studiaacademy
  • studiaeshop
  • About Studia
  • Getting to Studia
  • Studia School
  • Studia Tutoring
  • Studia Consultation
  • Studia Workshop
  • Studia Care
  • Studia Shop
  • Studia Resources
  • Studia Blog
  • Studia Platform

© 2025 Studia Academy. All rights reserved.

  • Terms of Use
  • Privacy Policy

Contact Studia

Please fill out the form below, and we’ll get back to you as soon as possible.