REVISION NOTES
1.1.1 Use the following units: kilogram (kg), metre (m), metre/second (m/s), metre/second2 (m/s2), newton (N), second (s) and newton/kilogram (N/kg)
Quantity | Symbol | SI Unit |
Mass | m | Kilograms (kg) |
Distance | d | Metres (m) |
Velocity | v | Metres per second (m/s) |
Acceleration | a | Metres per second squared (m/s2) |
Force | F | Newtons (N) |
Time | t | Seconds (s) |
Gravitational Field Strength | g | Newtons per kilogram (N/kg) |
1.1.2 Use the following units: newton metre (Nm), kilogram metre/second (kg m/s)
Quantity | Symbol | SI Unit |
Moments | M | Newton metre (Nm) |
Momentum | p | Kilogram metre per second (kg m/s) |
1.1.3 Plot and explain distance−time graphs
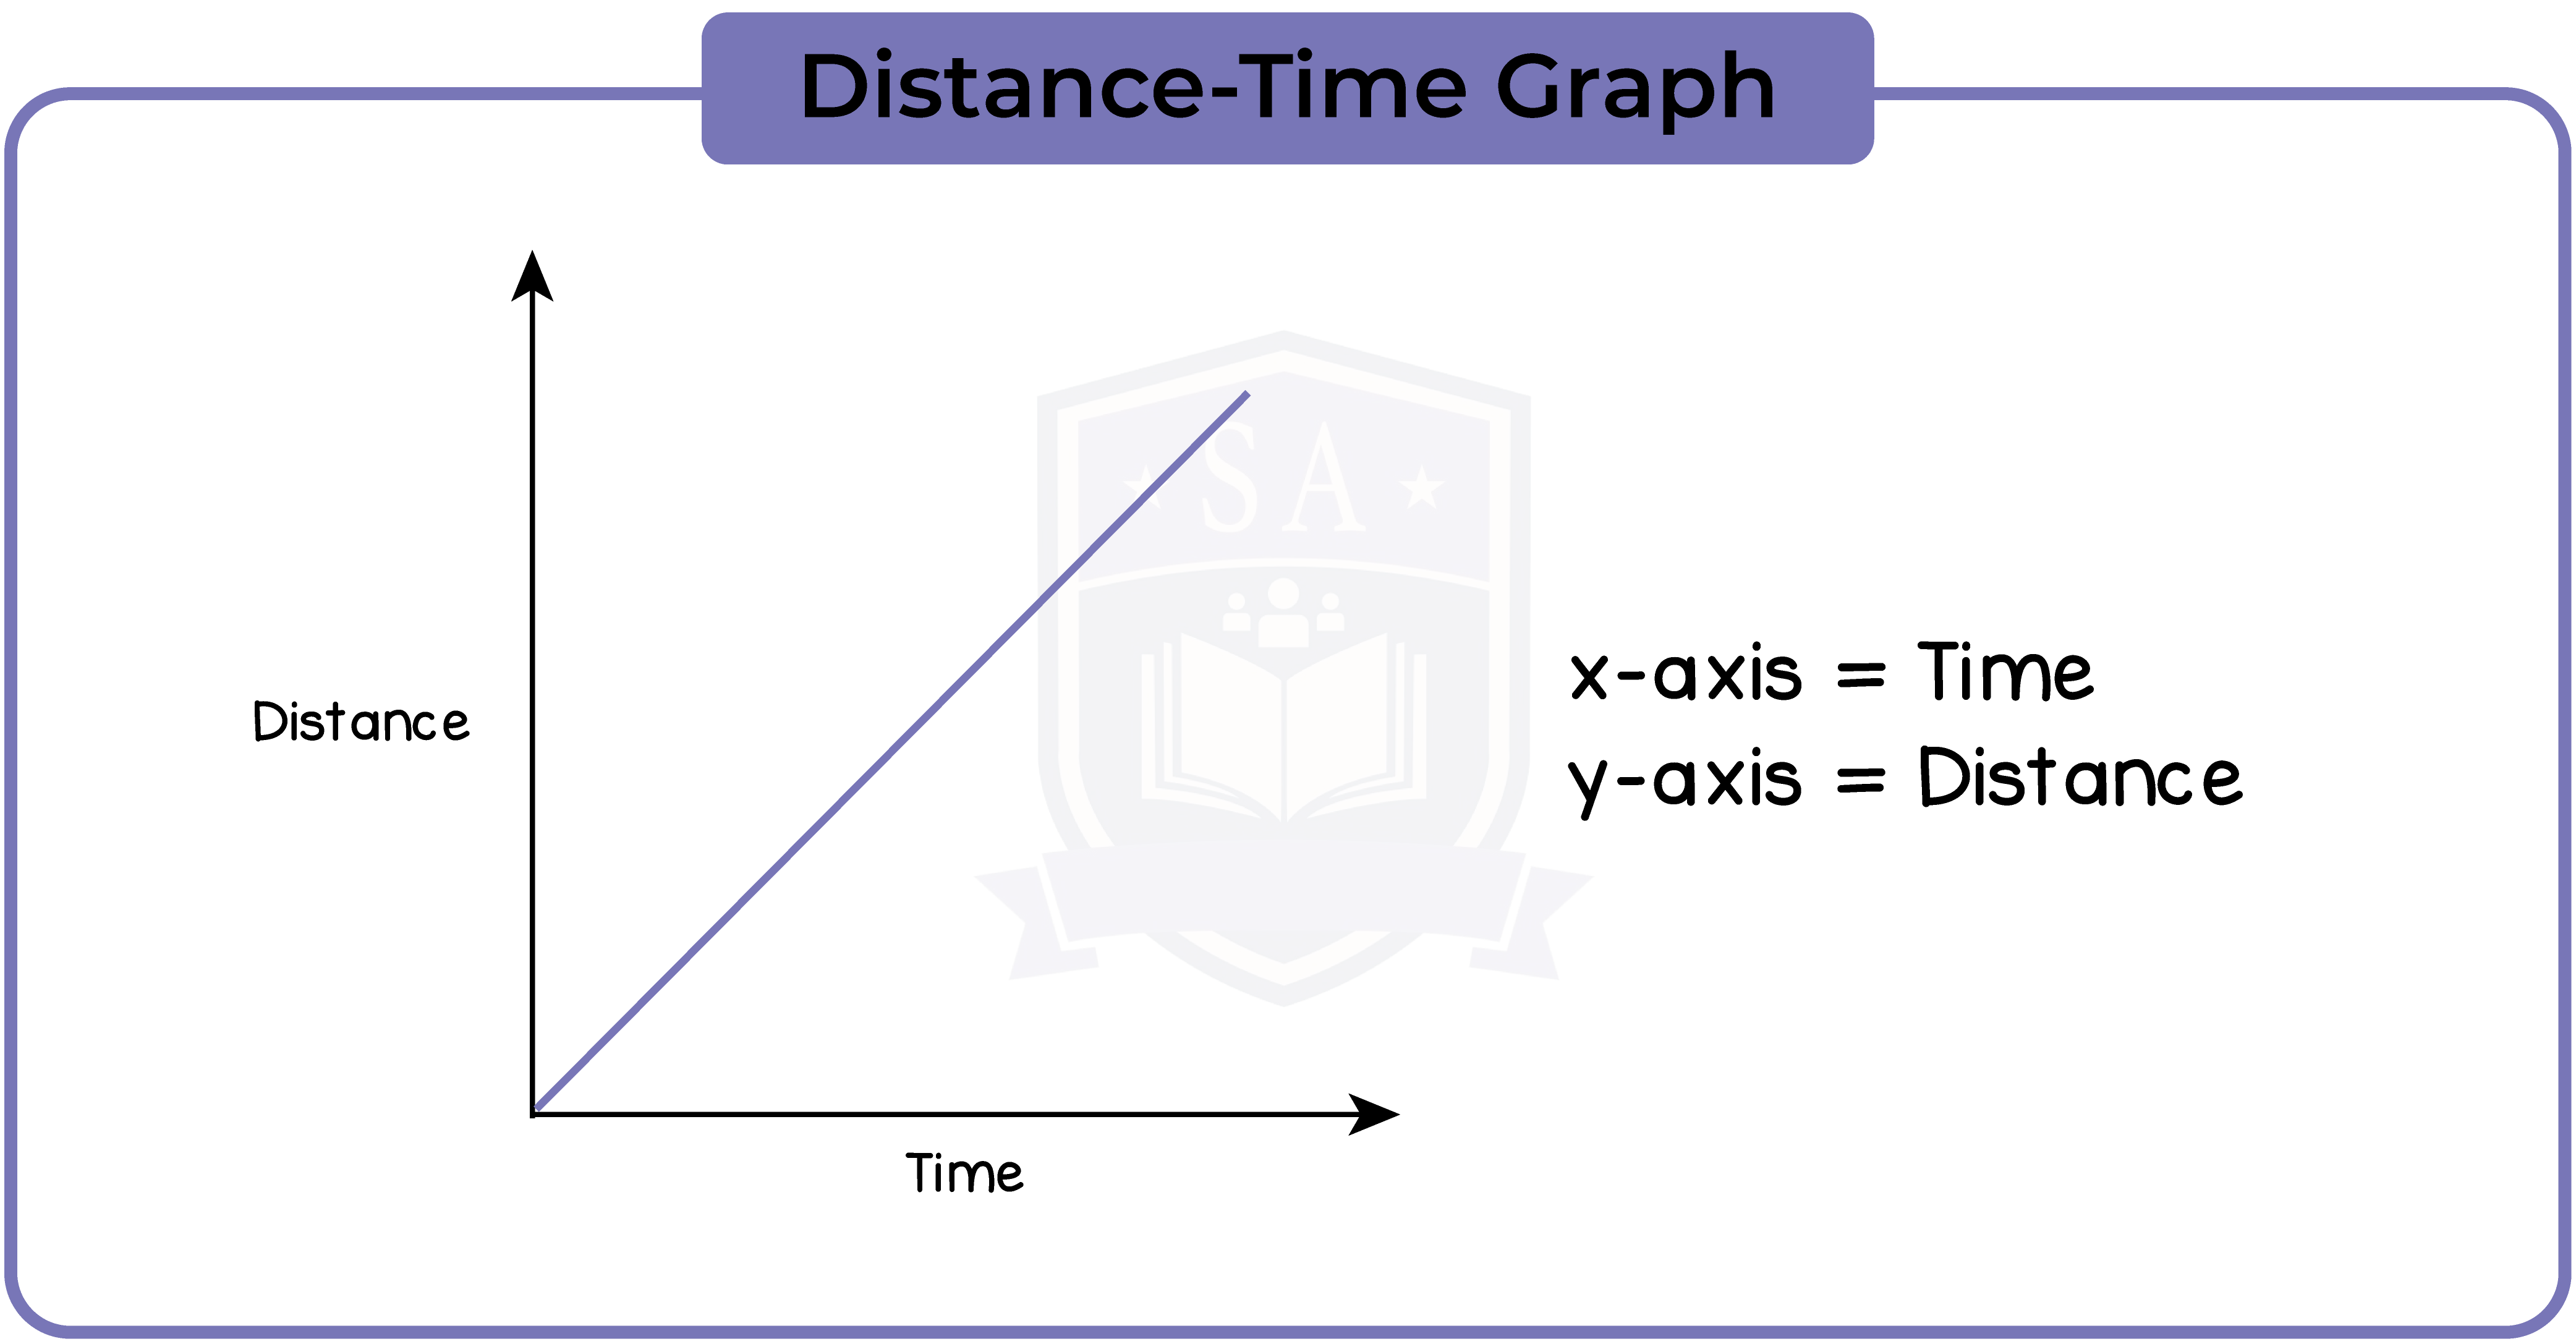

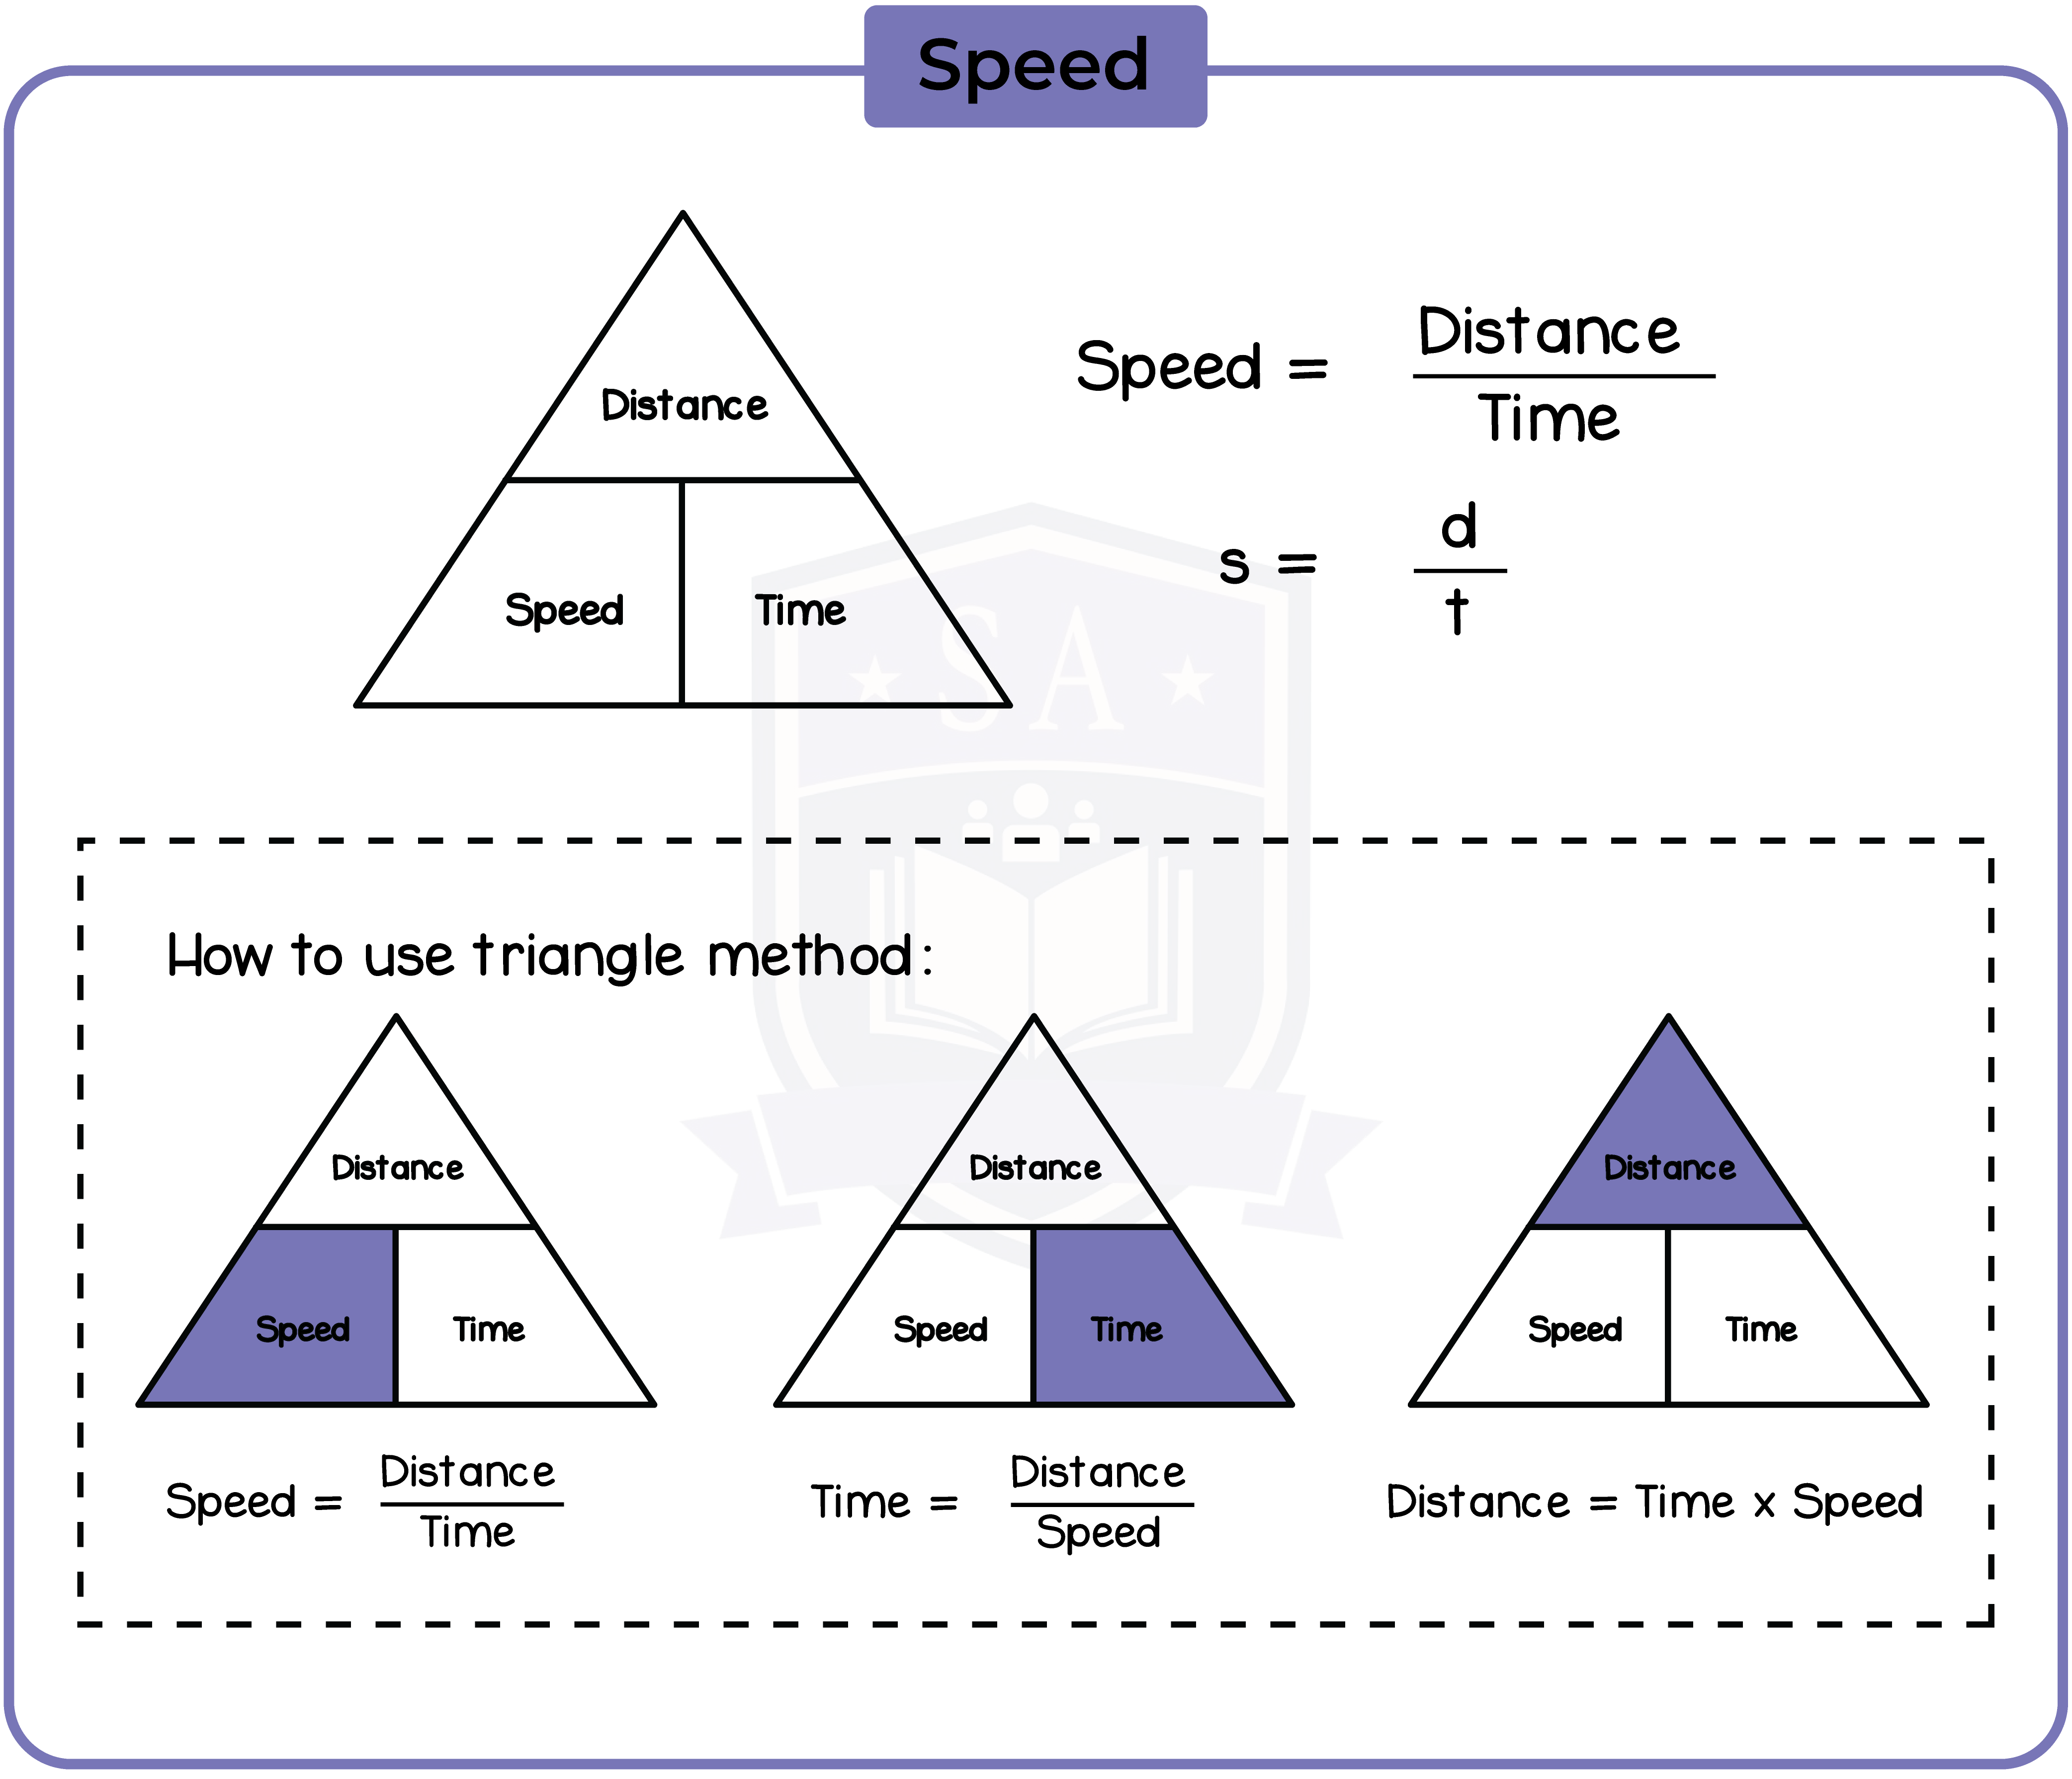
1.1.4 Know and use the relationship between average speed, distance moved and time taken:
1.1.5 Practical: investigate the motion of everyday objects such as toy cars or tennis balls
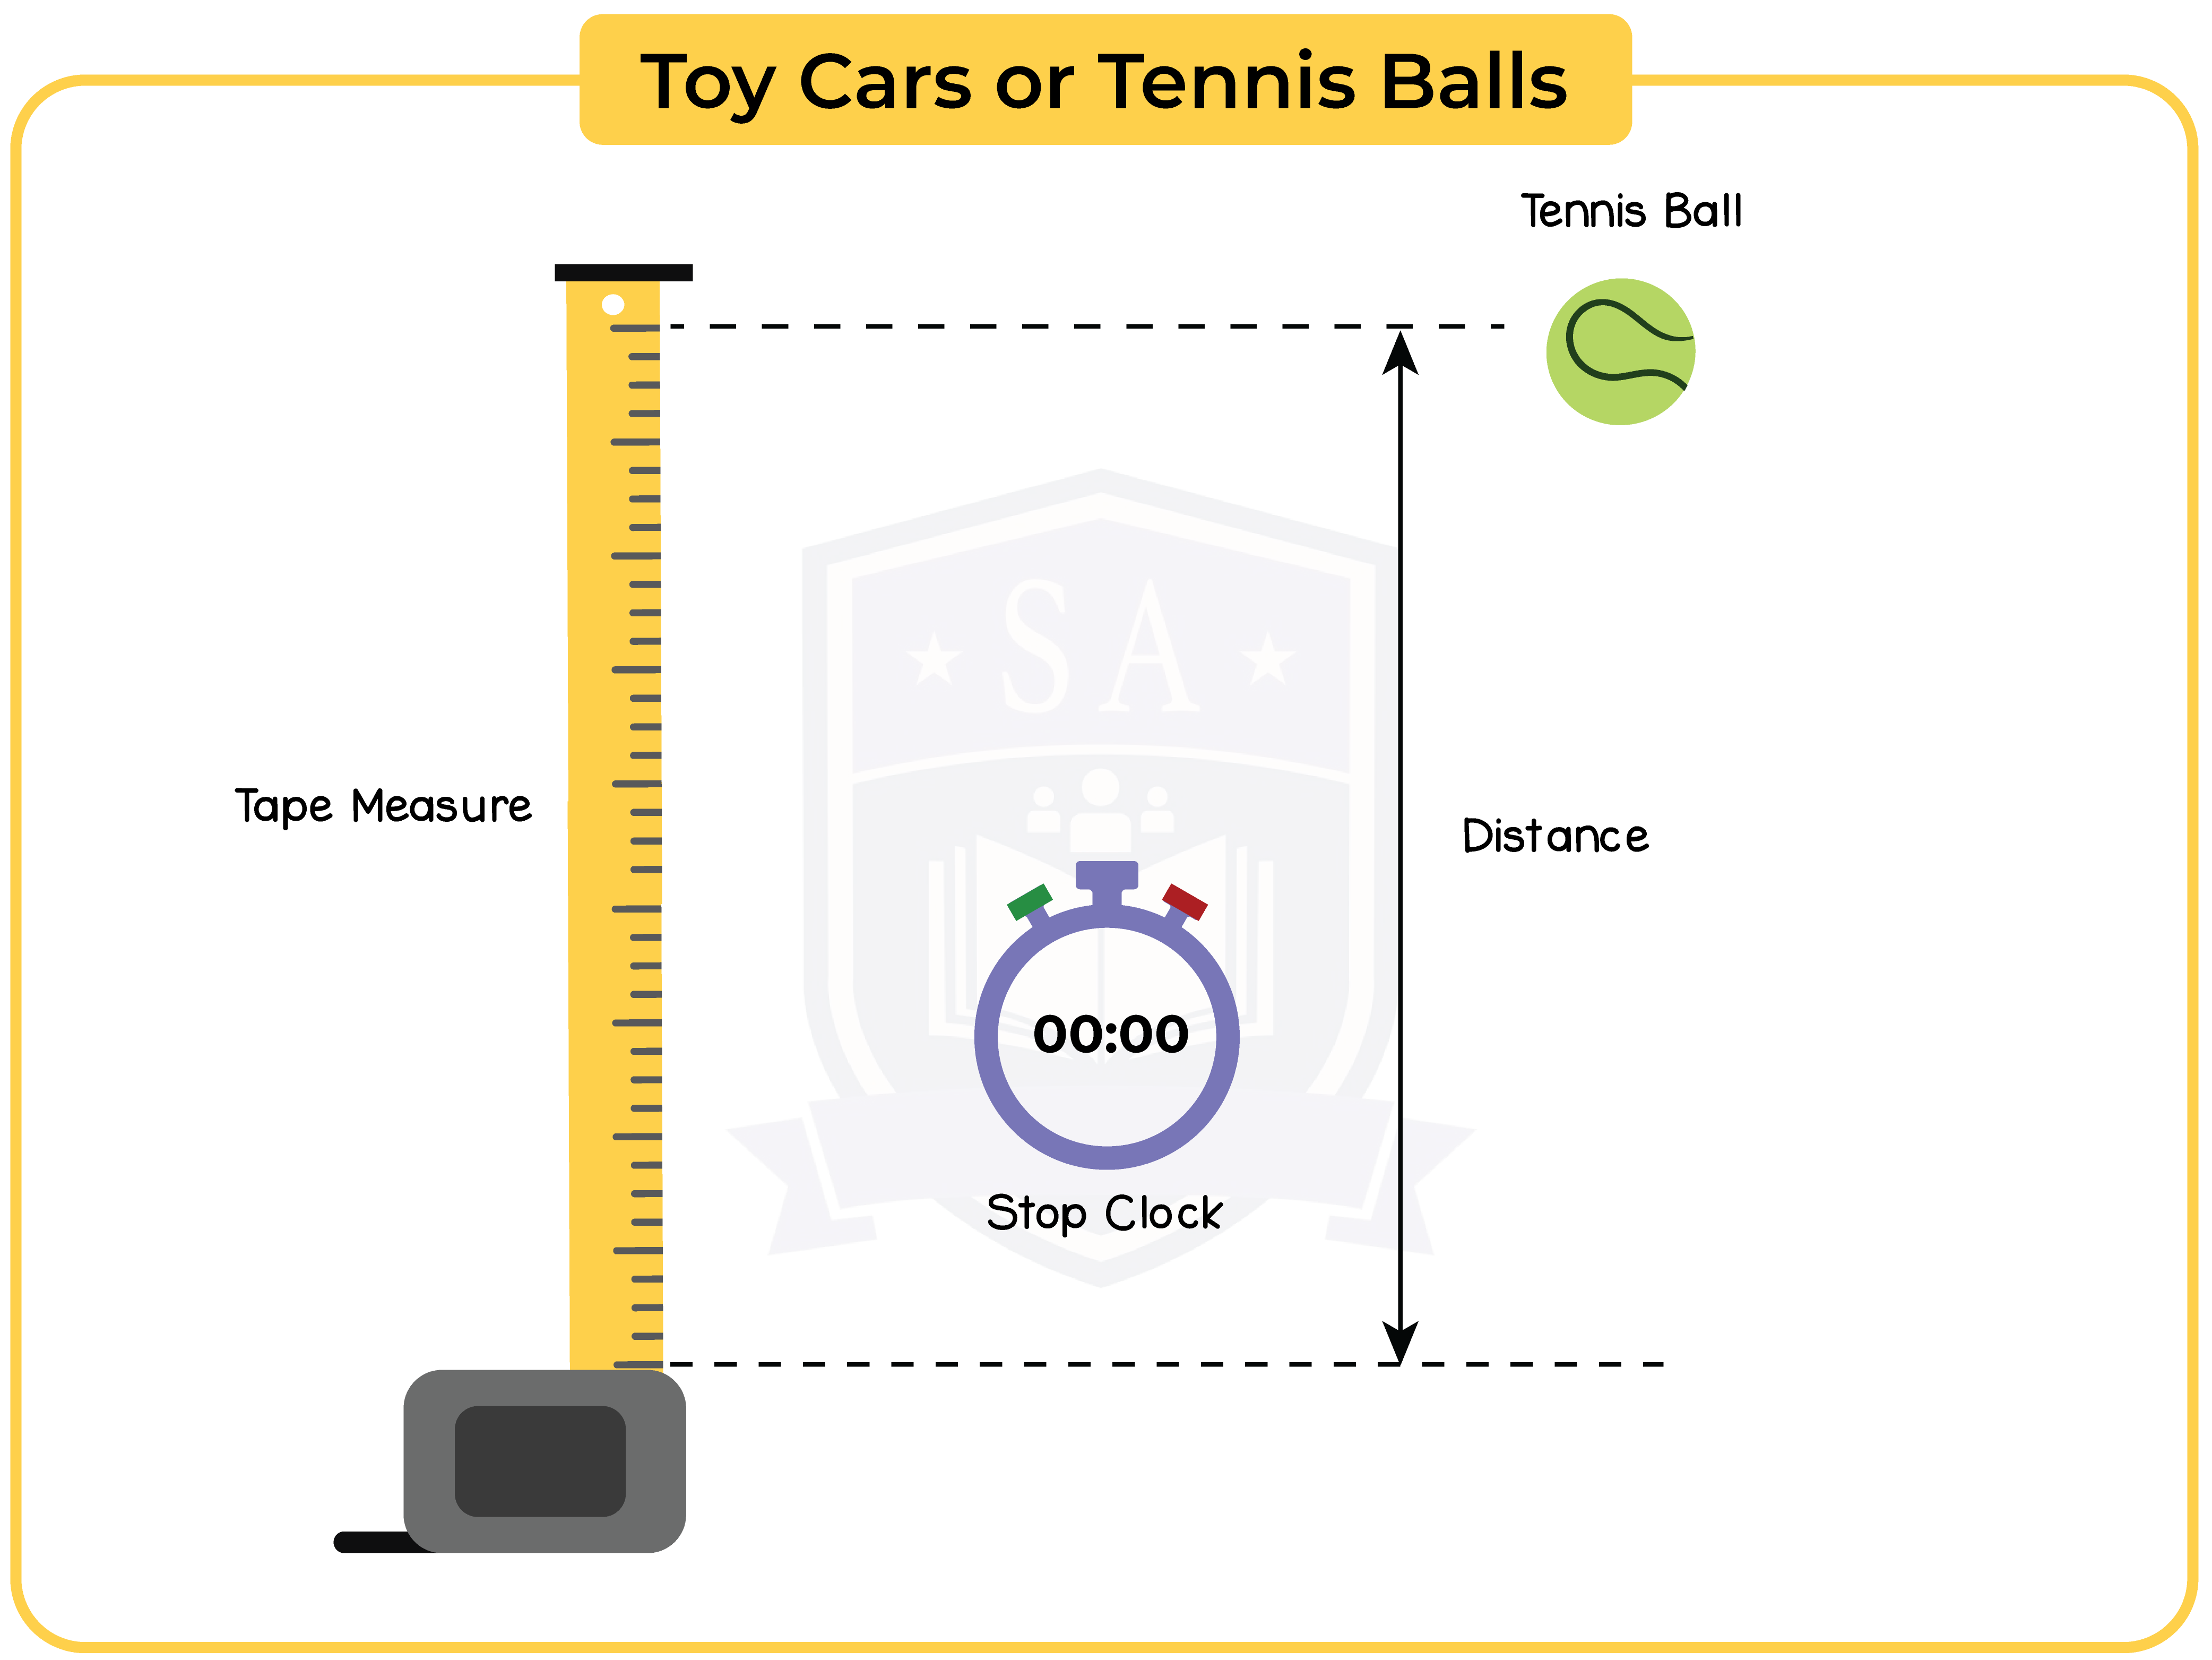
Apparatus needed:
Method:
Control variables:
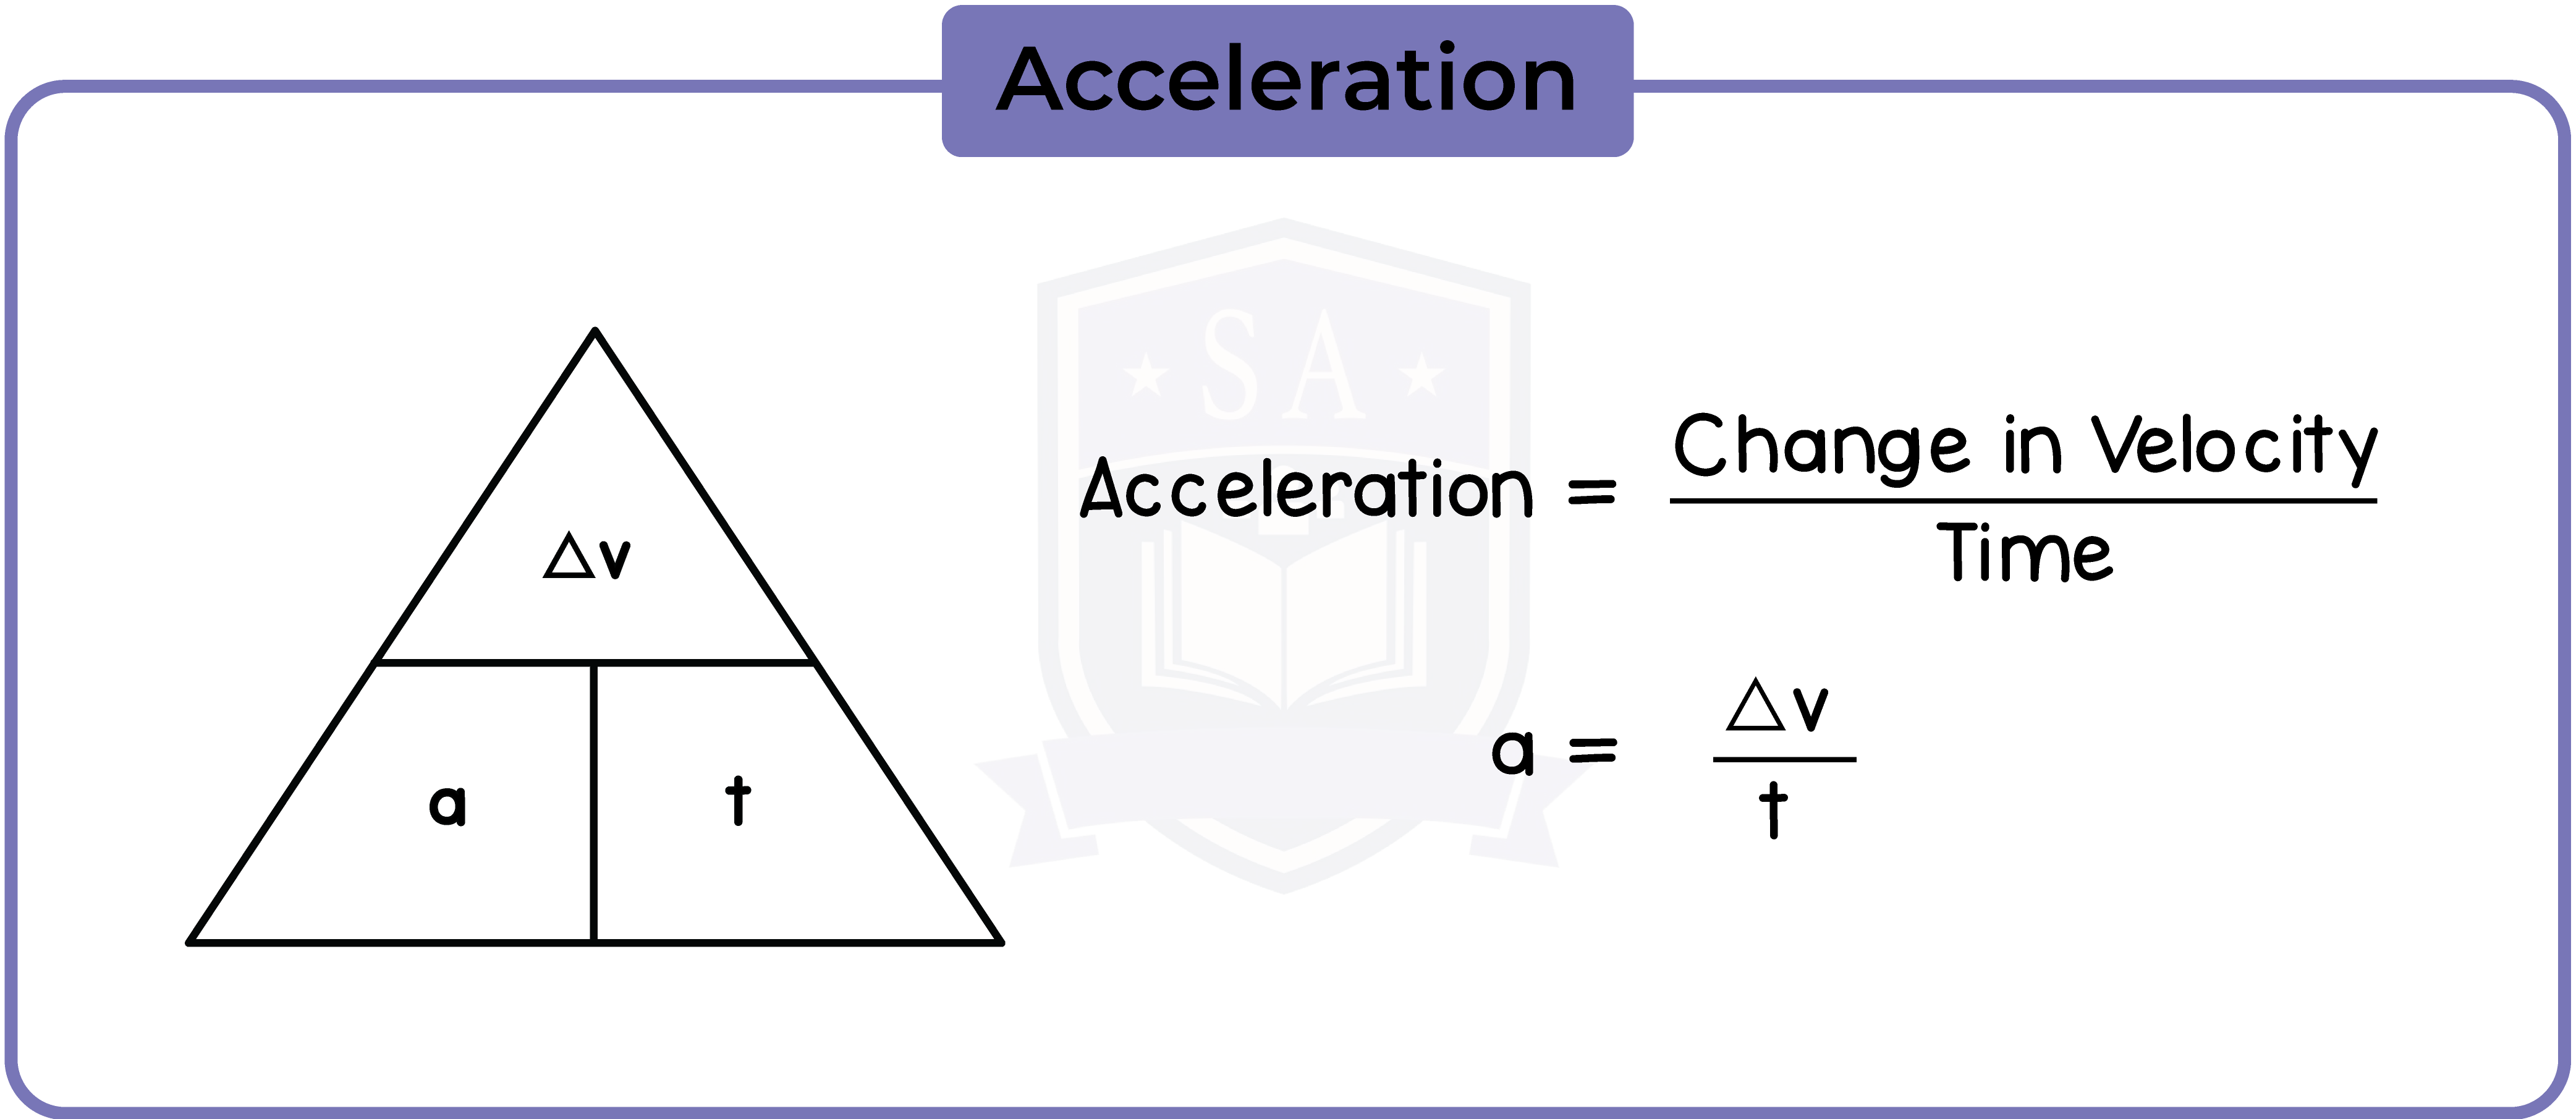
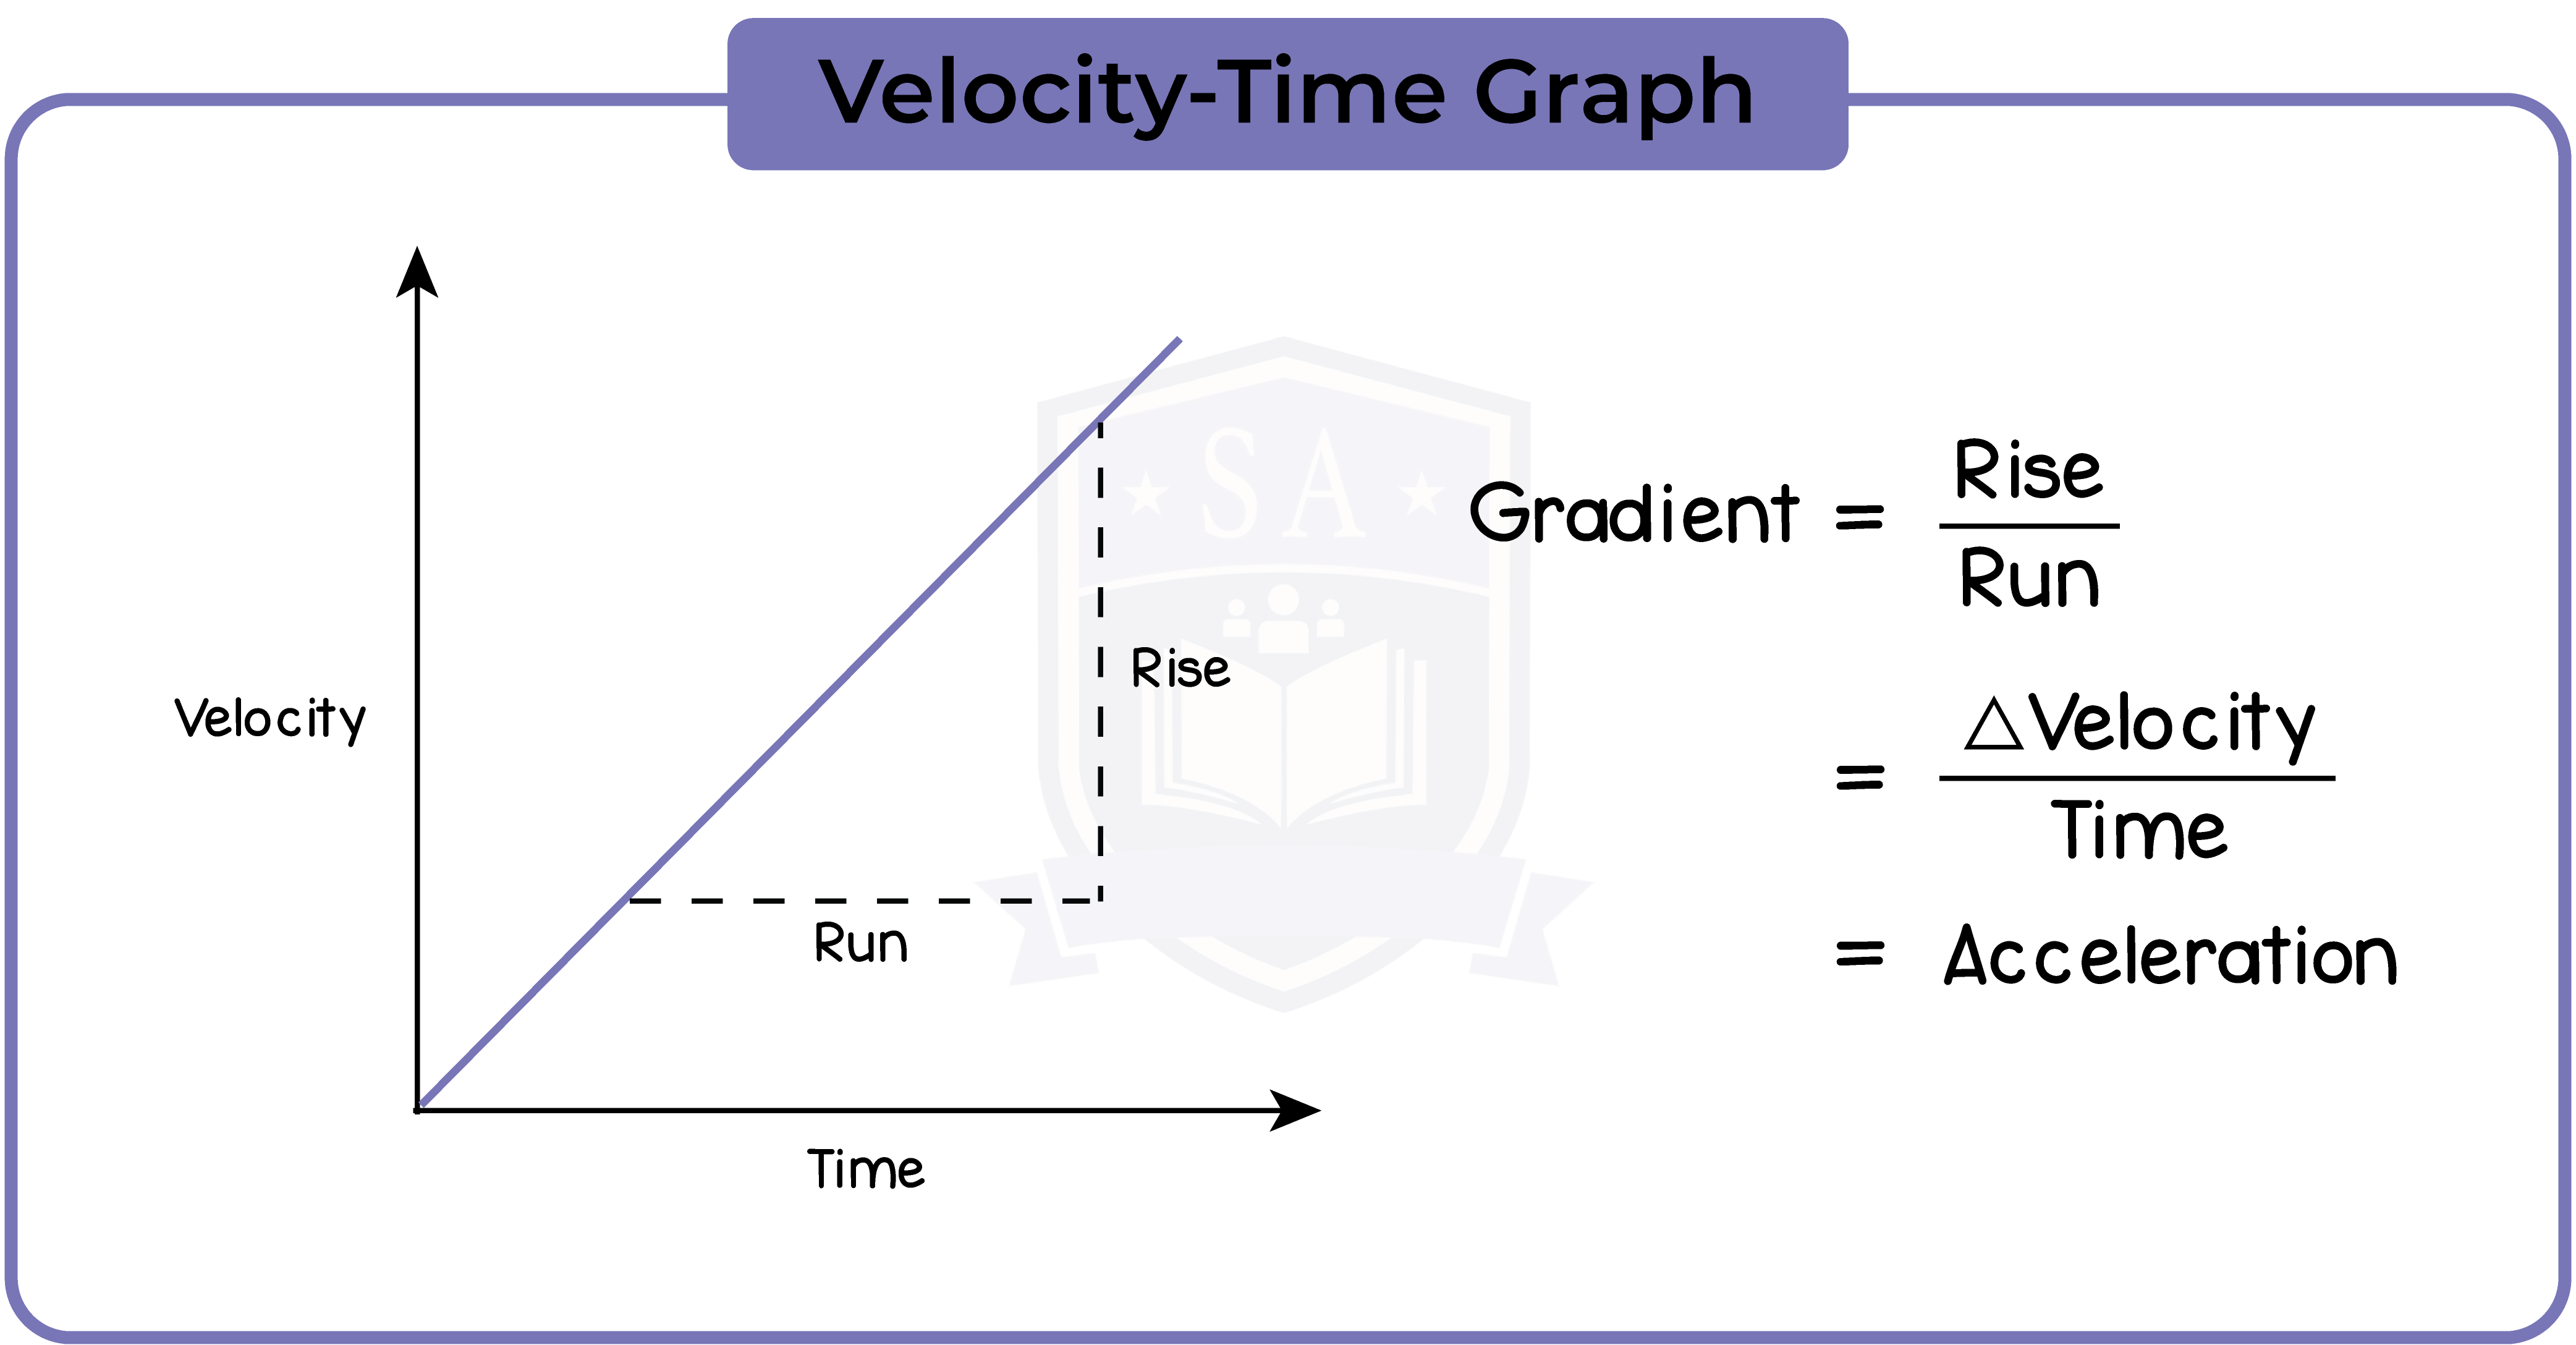
1.1.6 Know and use the relationship between acceleration, change in velocity and time taken: acceleration = change in velocity/time taken
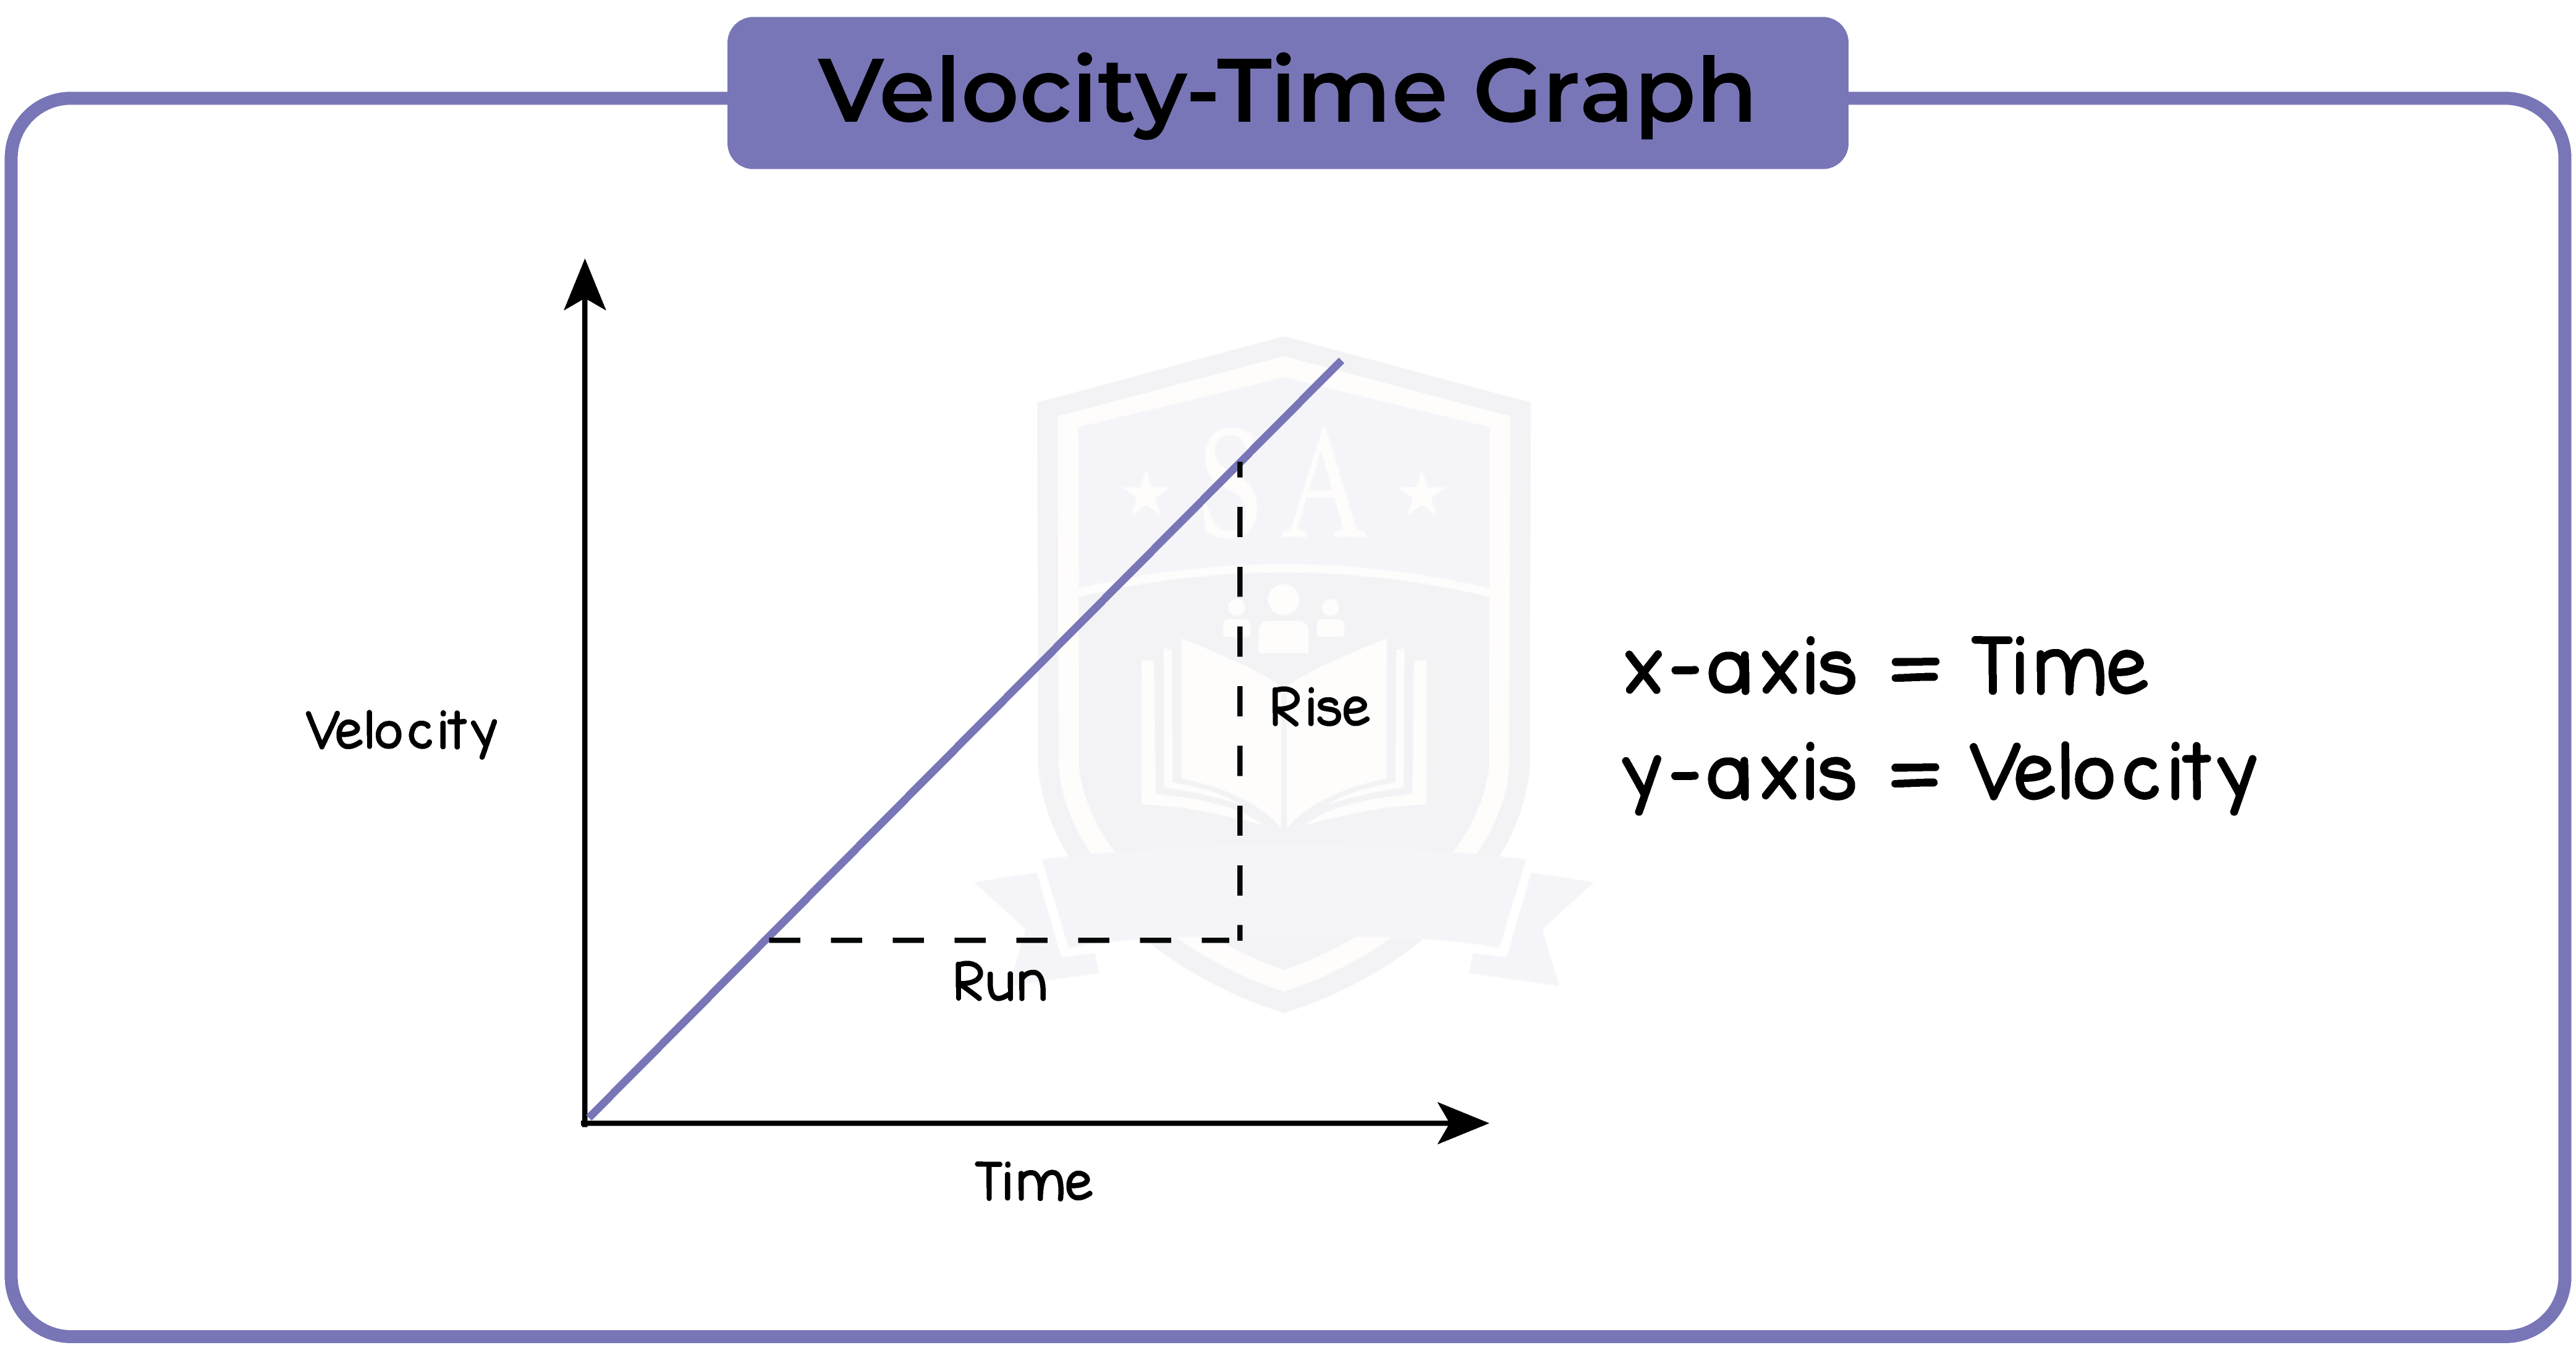
1.1.7 Plot and explain velocity−time graphs

The area under the the graph is equal to the distance travelled.
1.1.8 Determine acceleration from the gradient of a velocity−time graph
1.1.9 Determine the distance travelled from the area between a velocity−time graph and the time axis
1.1.10 Use the relationship between final speed, initial speed, acceleration and distance moved:


© 2025 Studia Academy. All rights reserved.