REVISION NOTES
IGCSE Edexcel Chemistry
1.1 States of Matter
1.1.1 Understand the three states of matter in terms of the arrangement, movement and energy of the particles
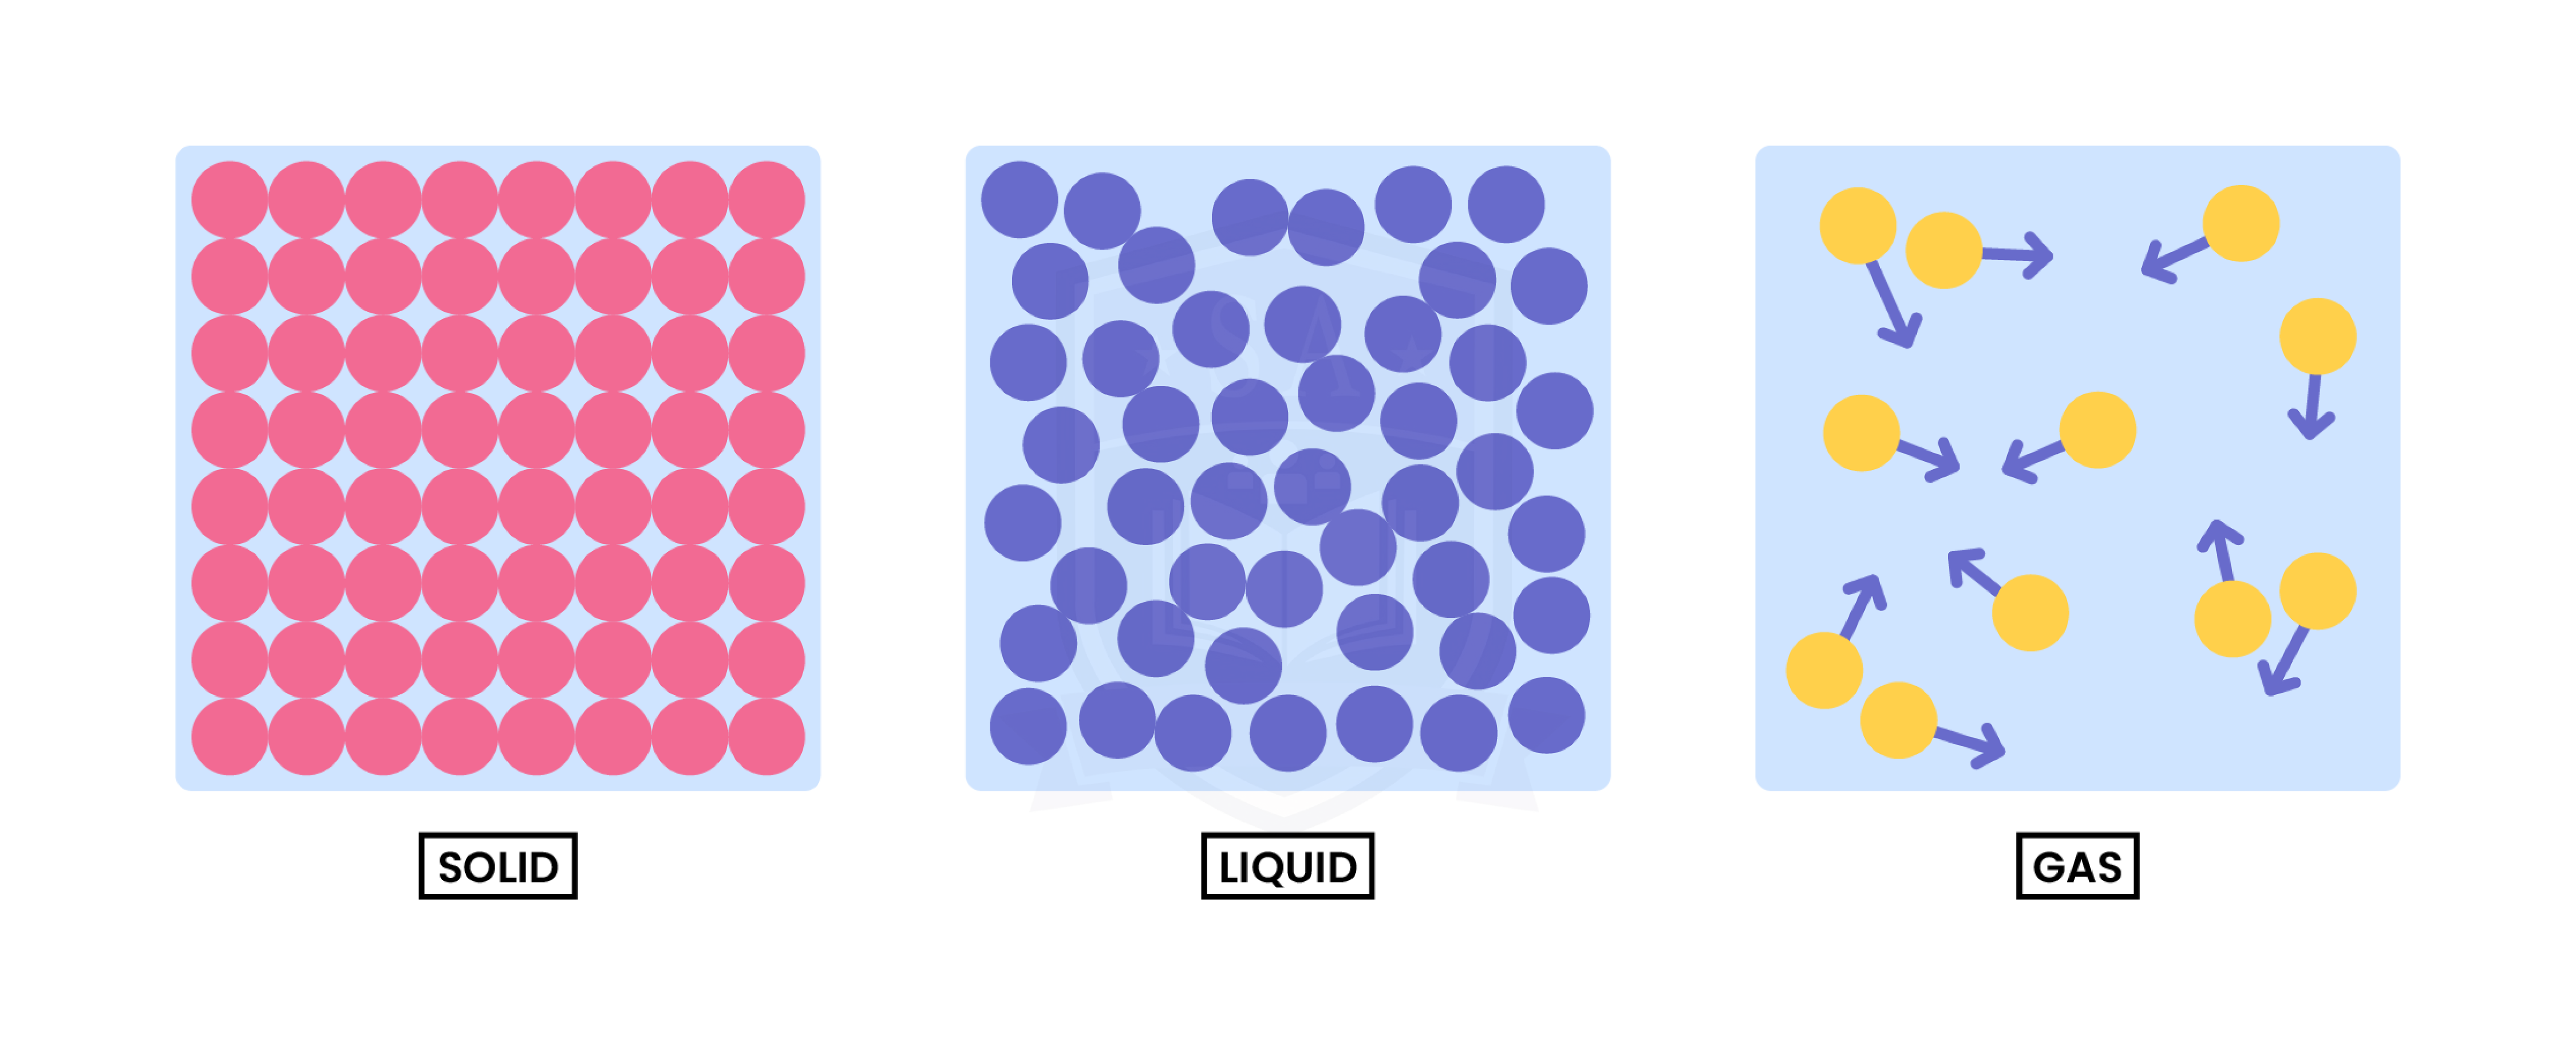
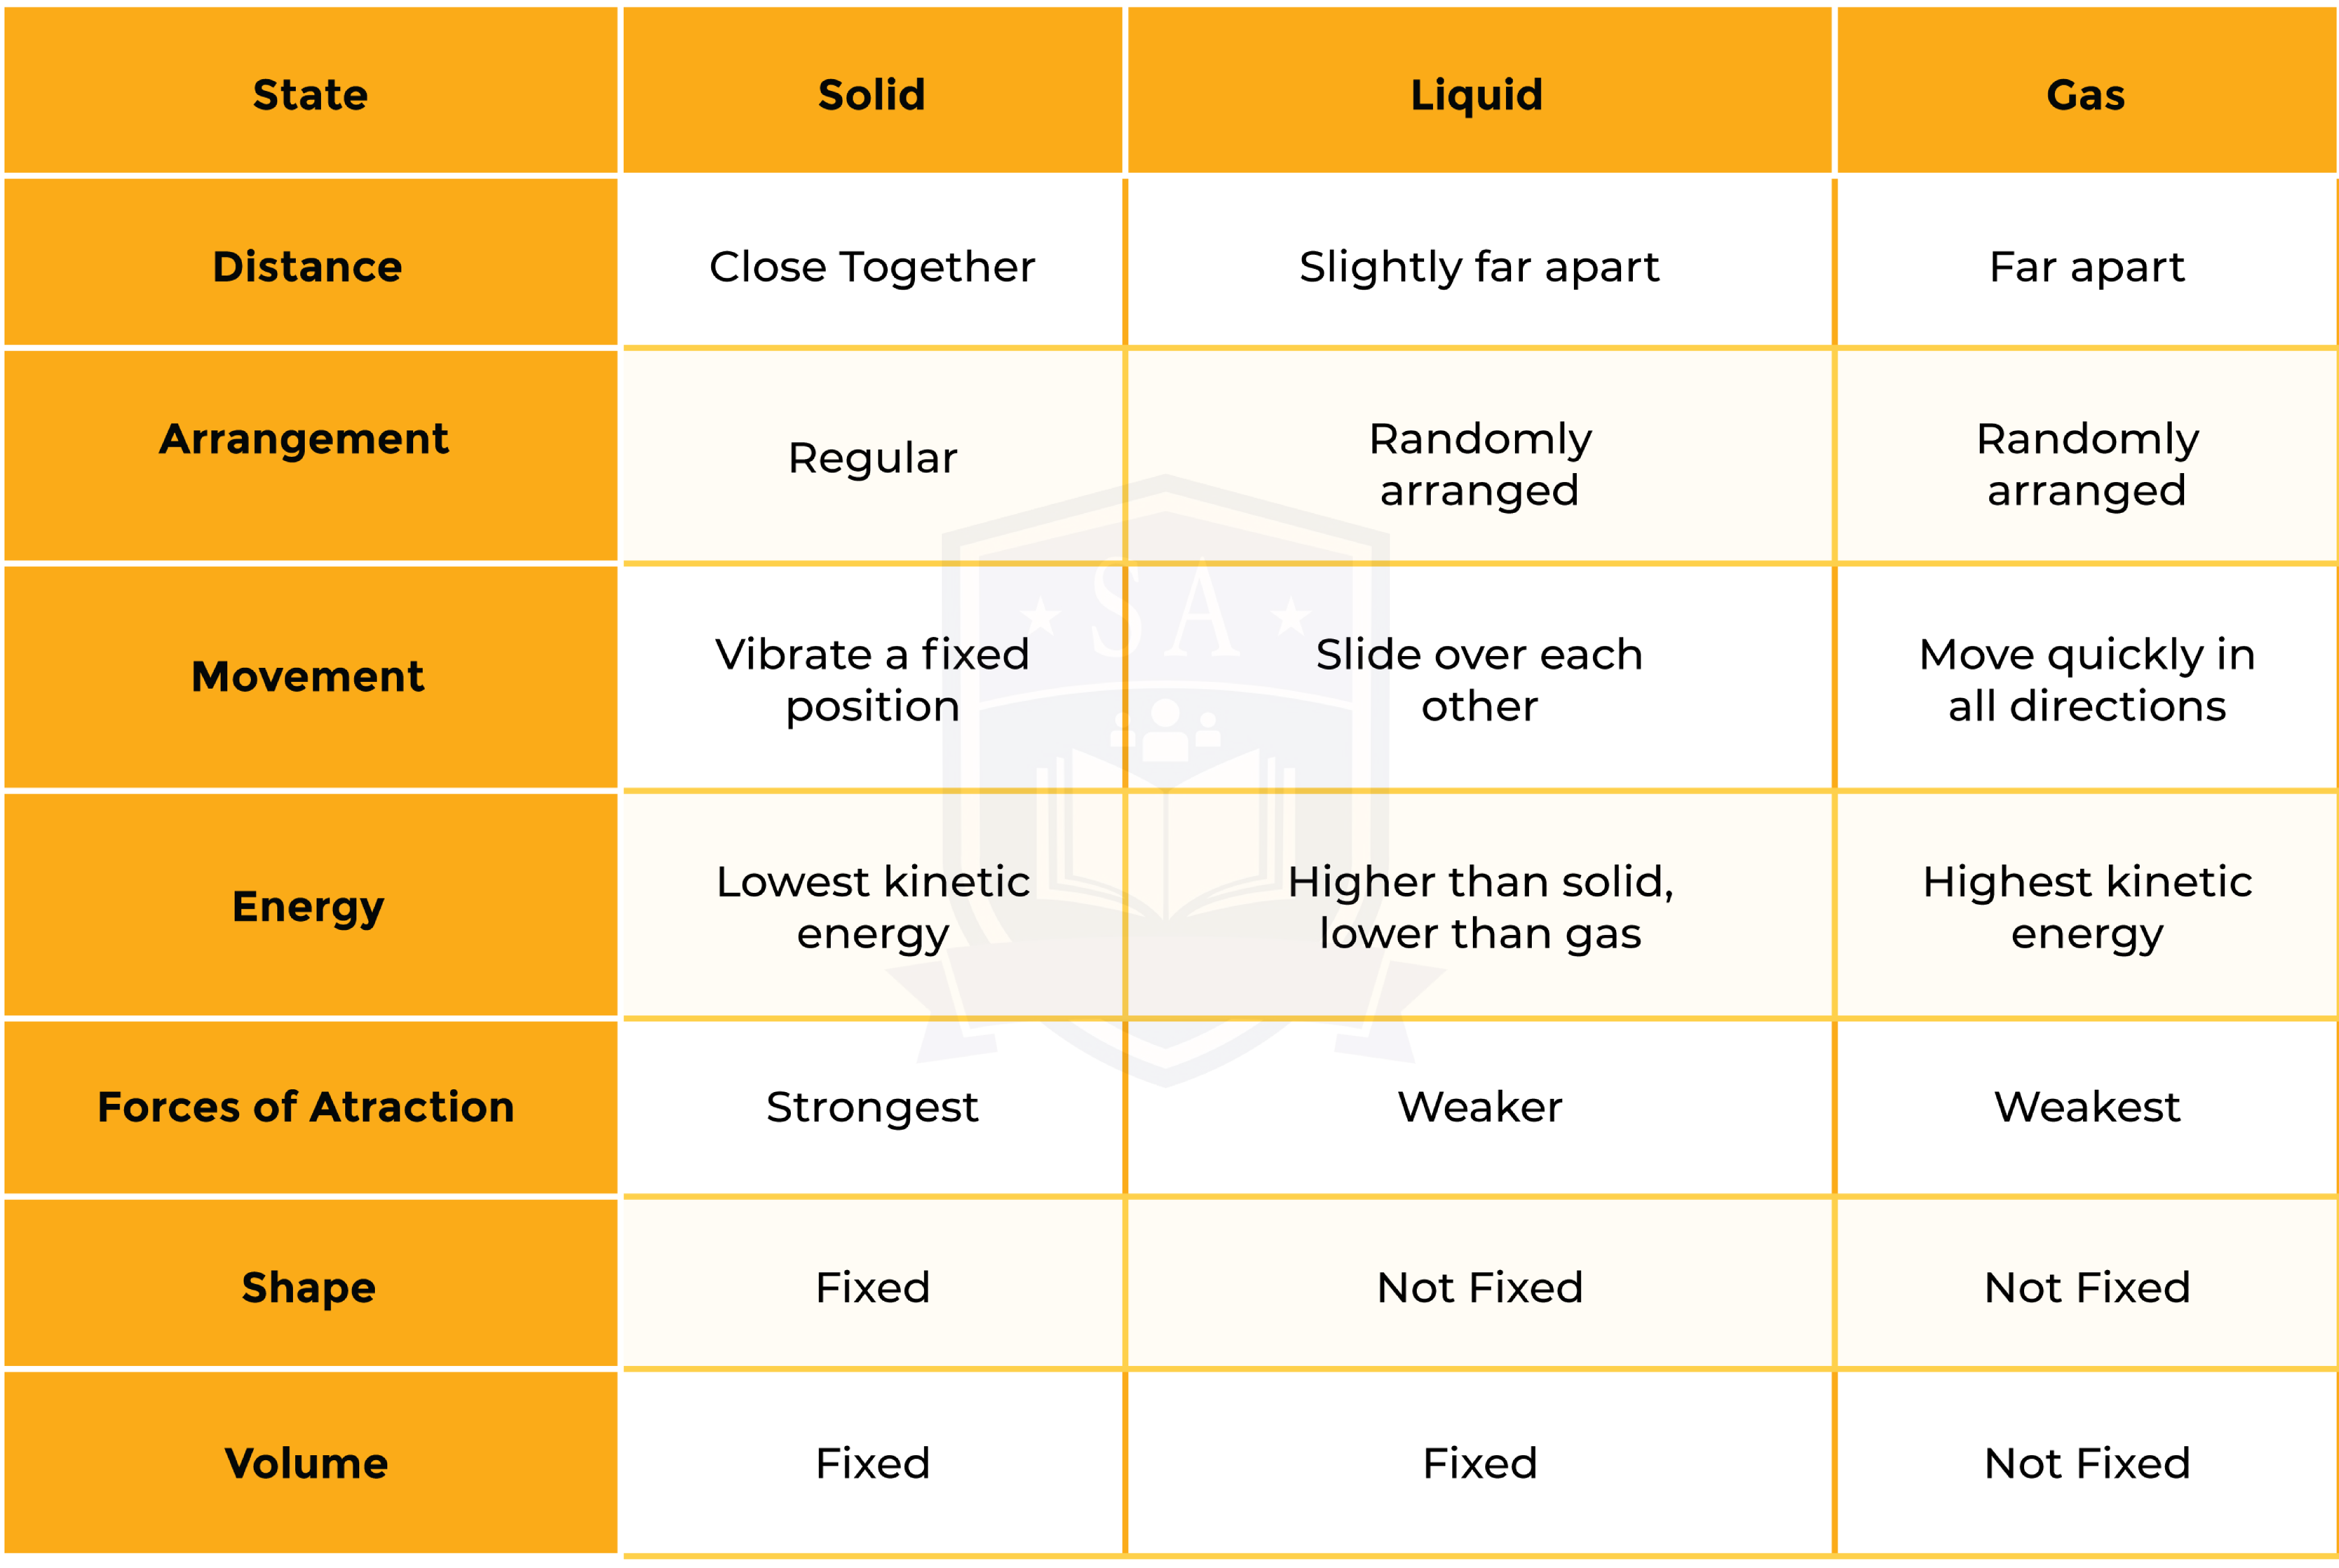
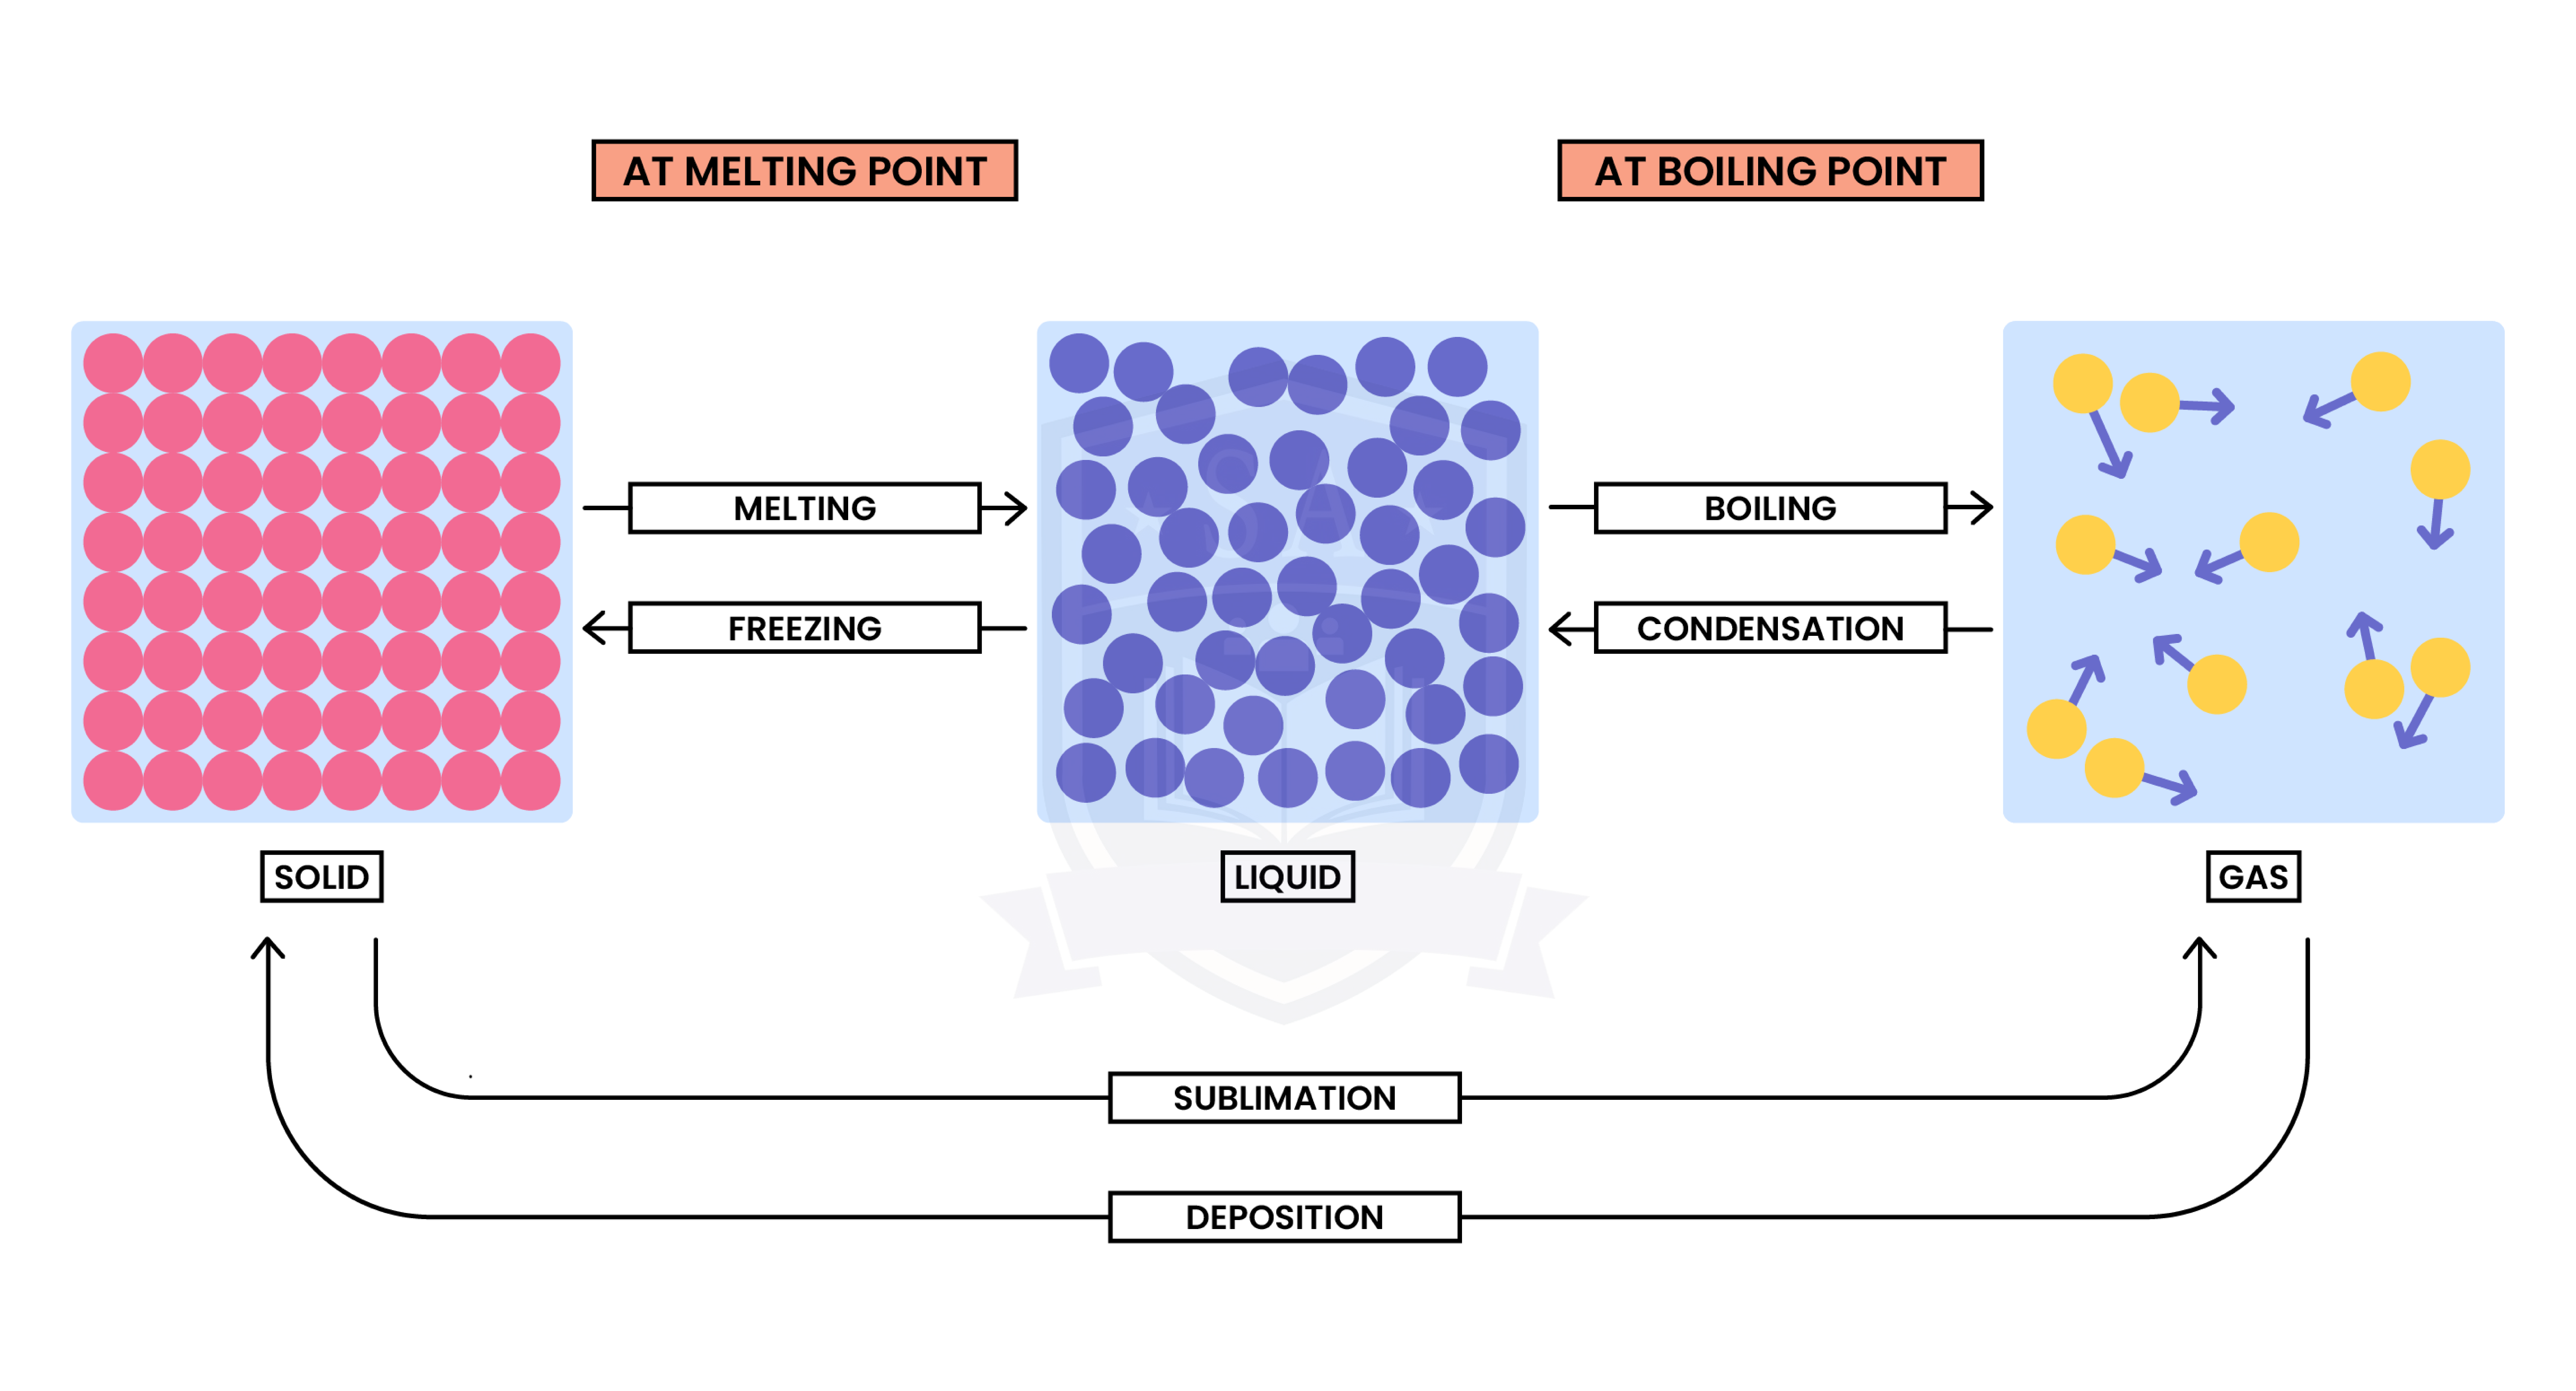
1.1.2 Understand the interconversions between the three states of matter in terms of:
- The names of the interconversions
- How they are achieved
- The changes in arrangement, movement and energy of the particles.
Interconversion between different states of matter is a physical change
- There is no new substance formed after the change
- Although the forces between the particles change, the particles themselves and their chemical properties are still the same
From solid to liquid to gas (left to right):
- Particles gain more kinetic energy through heating
- Move around more and become more randomly arranged
- Particles are further apart
From gas to liquid to solid (right to left):
- Particles lose kinetic energy (therefore release heat)
- Move less and become more regularly arranged
- Particles are closer together
When there is a change in state, the temperature does not change
- The heat supplied is used to break the attraction forces between particles, instead of raising the temperature
1.1.3 Understand how the results of experiments involving the dilution of coloured solutions and diffusion of gases can be explained
DIFFUSION
- Diffusion: random movement of particles from an area of high concentration to an area of low concentration
- Diffusion only happens in liquid and gas
- Because particles need to be able to move around
Both diffusion and dilution support the theory that:
- All matter is made up of tiny, moving particles
Experiment 1: Diffusion in Gas
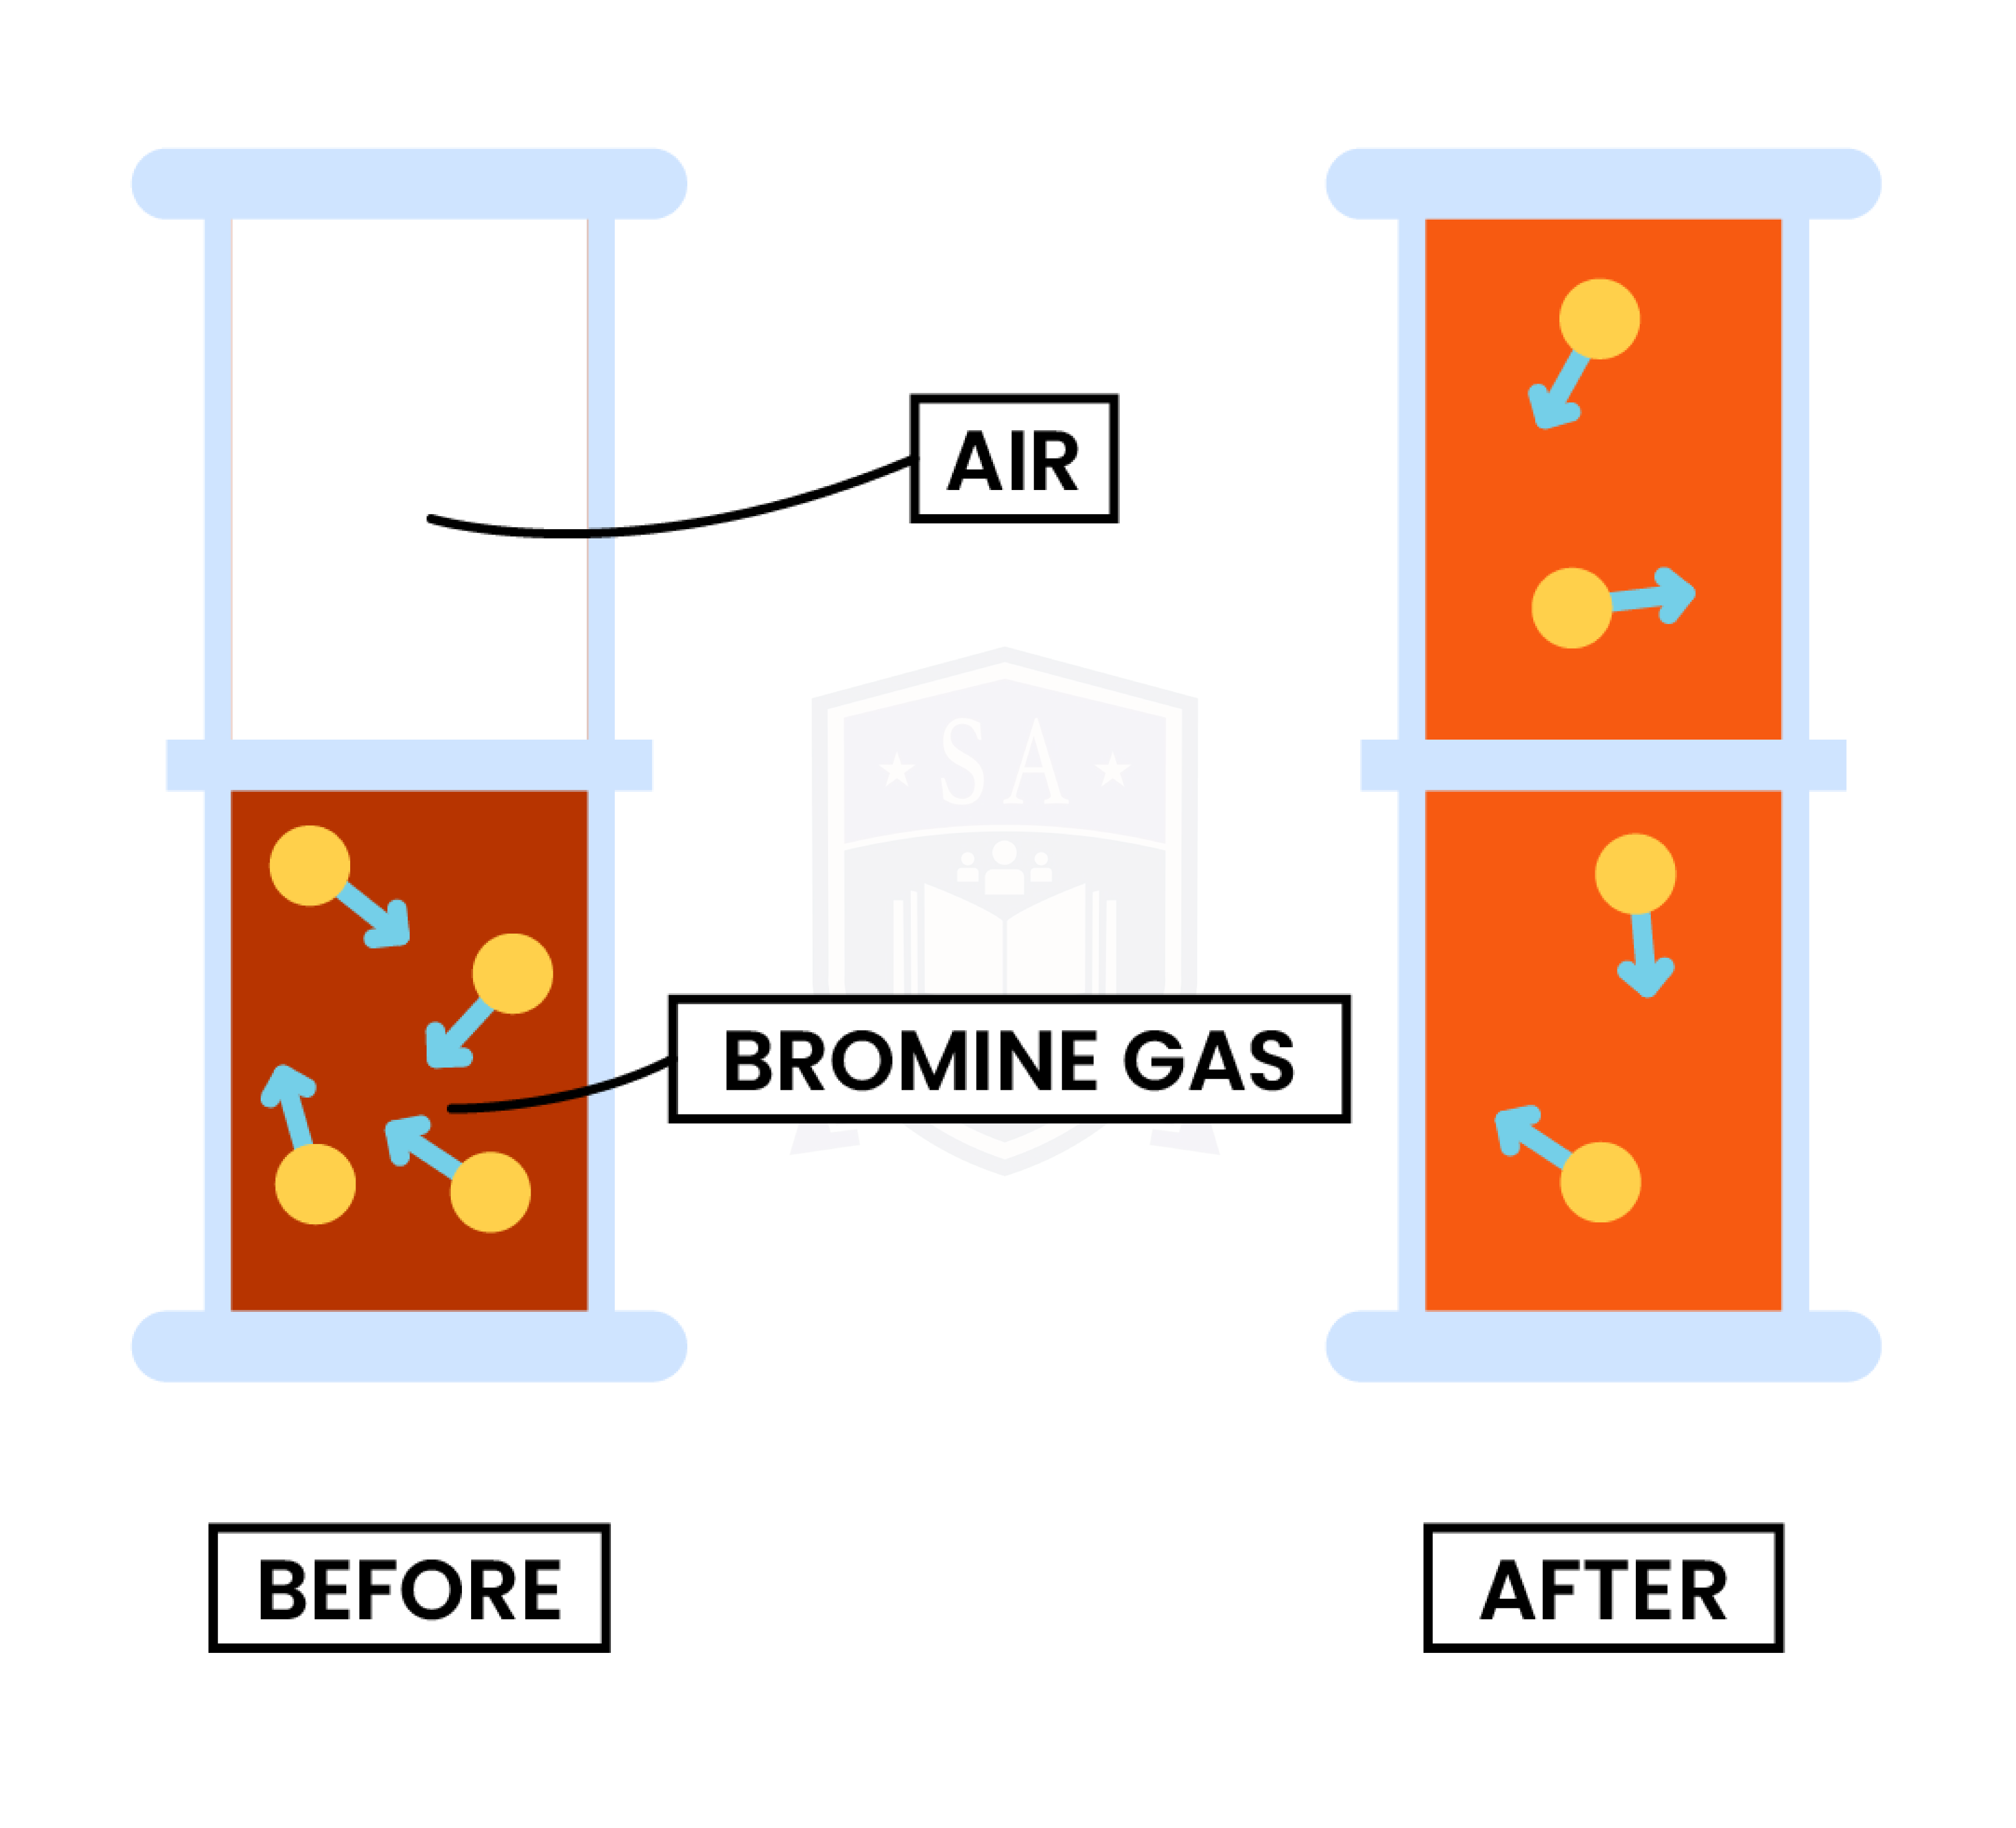
Observation
- Bromine gas is placed at the bottom of the container
- After several minutes, bromine gas diffuses to the top of the container
- Bromine gas is evenly distributed in the container
Explanation
- Air particles and bromine gas particles are moving randomly in the container
- Bromine gas particles travel from an area of high concentration to low concentration
Experiment 2: Diffusion in Liquid
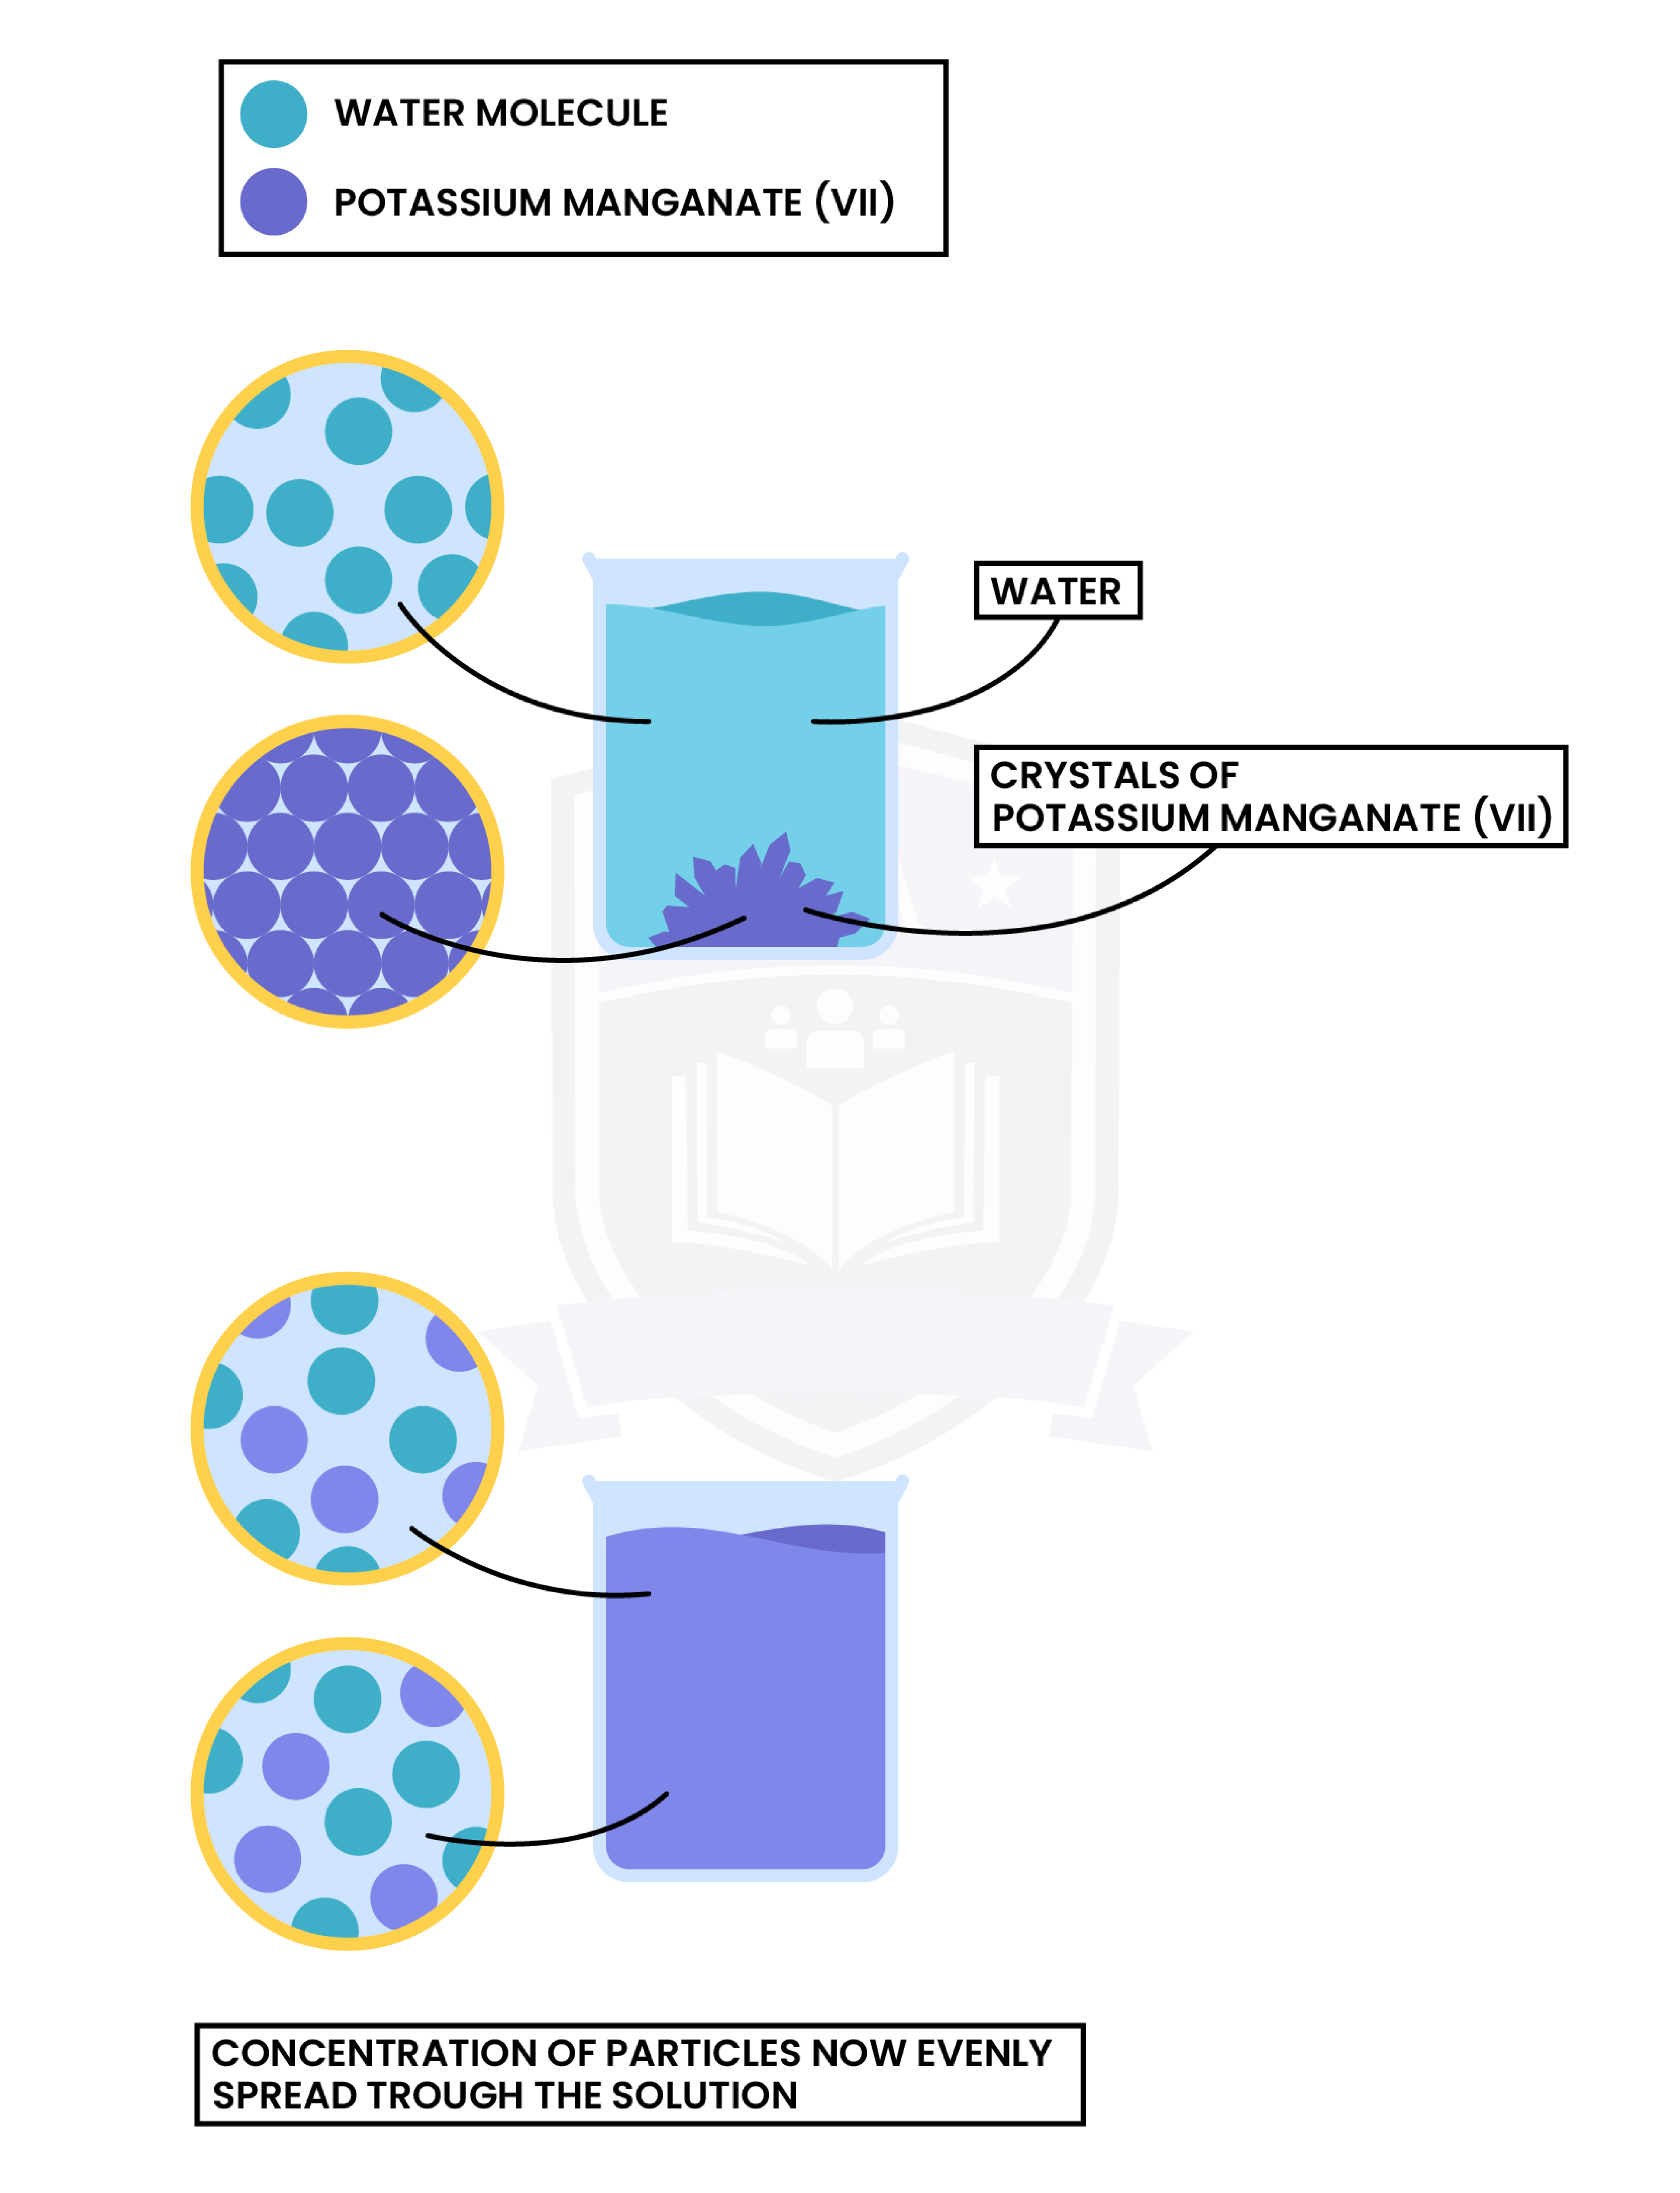
Observation
- Potassium manganate (VII) crystals are placed in water
- Potassium manganate molecules diffuse through the solution
- An even purple solution is formed in the end
Explanation
- Water molecules and potassium manganate (VII) crystals are moving randomly
- Particles are mixed together, travelling from an area of high concentration to low concentration
- However, diffusion in liquid is slower than diffusion in gas because the particles move more slowly and are more closely packed together
Experiment 3: Dilution
Dilution, together with diffusion, is one of the experiments which support the theory that: all matter is made up of tiny, moving particles.
Observation
- After potassium manganate (VII) crystals are dissolved in water, it becomes a solution
- The solution can then be diluted several times
- The colour fades but does not disappear
Explanation
- There are many potassium manganate (VII) particles present in the solution
- When the solution is diluted, more water is added
- However, the number of potassium manganate particles does not change
- The colour of the solution fades because particles are evenly distributed in solution with larger and larger volume
1.1.4 Know what is meant by the terms:
- Solvent
- Solute
- Solution
- Saturated solution
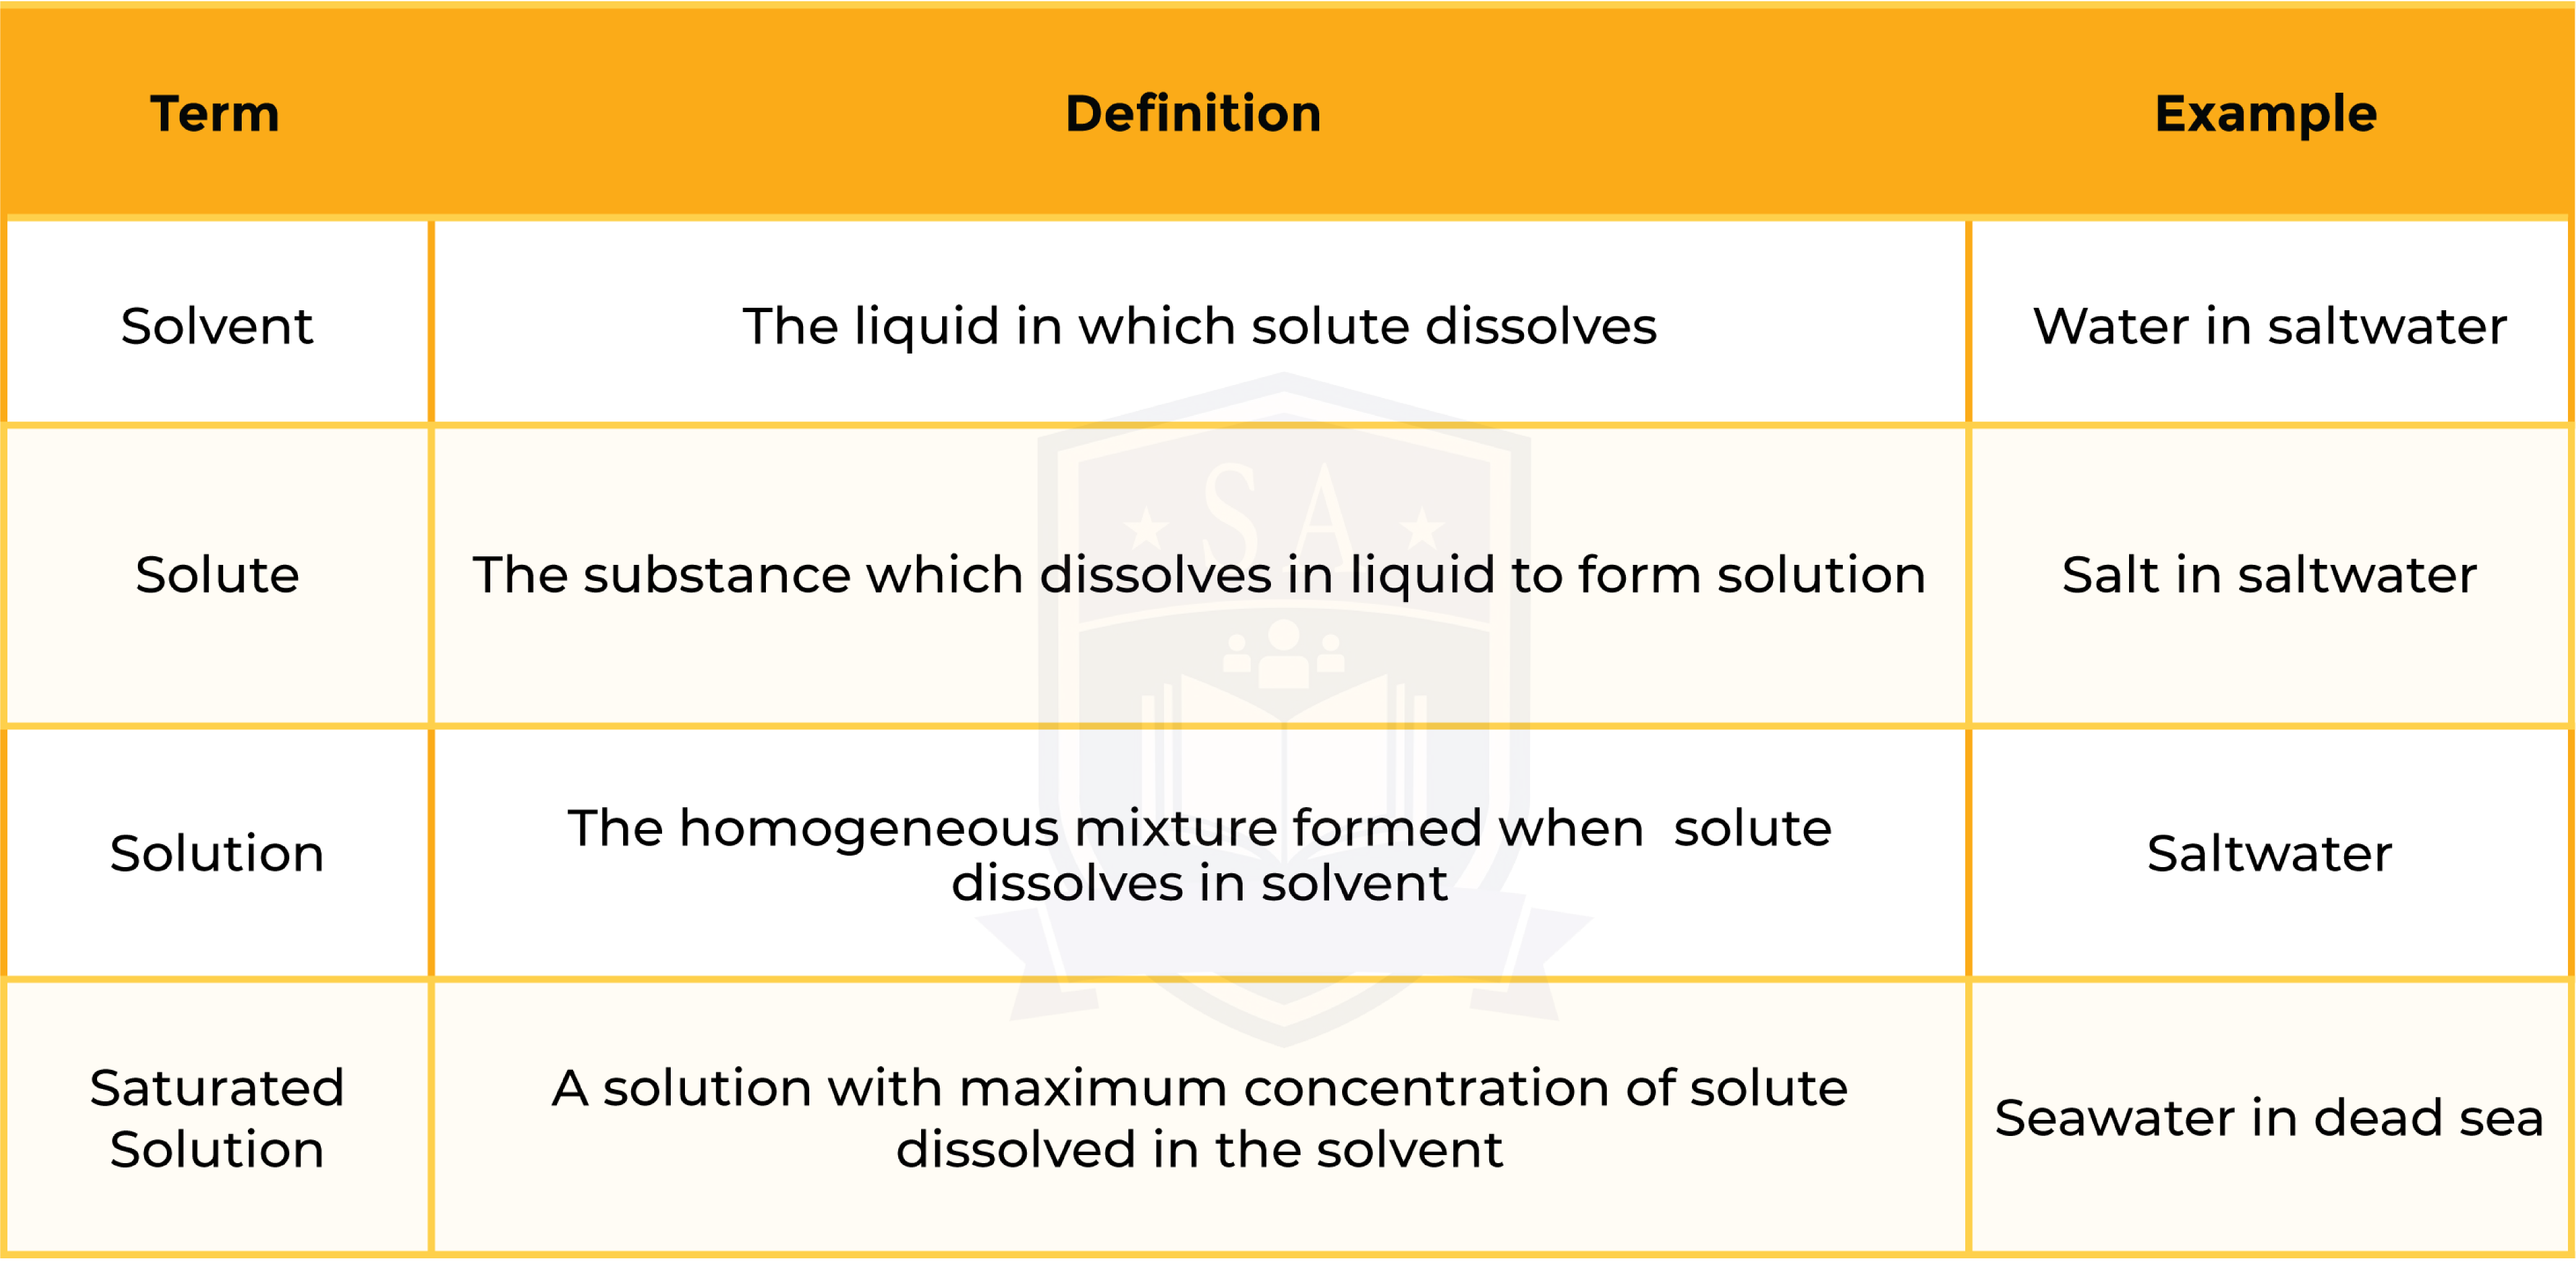
1.1.5C Know what is meant by the term solubility in the units g per 100 g of solvent
SOLUBIILITY
- Definition: the amount of solute that will dissolved in a given volume of solvent
- It can be expressed in g per 100g of solvent
- Different substances have different solubilities
Solubility of solids depend on temperature:
- When temperature increases, the solubility of solids increases
Solubility of gases depend on both temperature and pressure:
- When temperature increases, the solubility of gases decreases
- When pressure increases, the solubility of gases increases
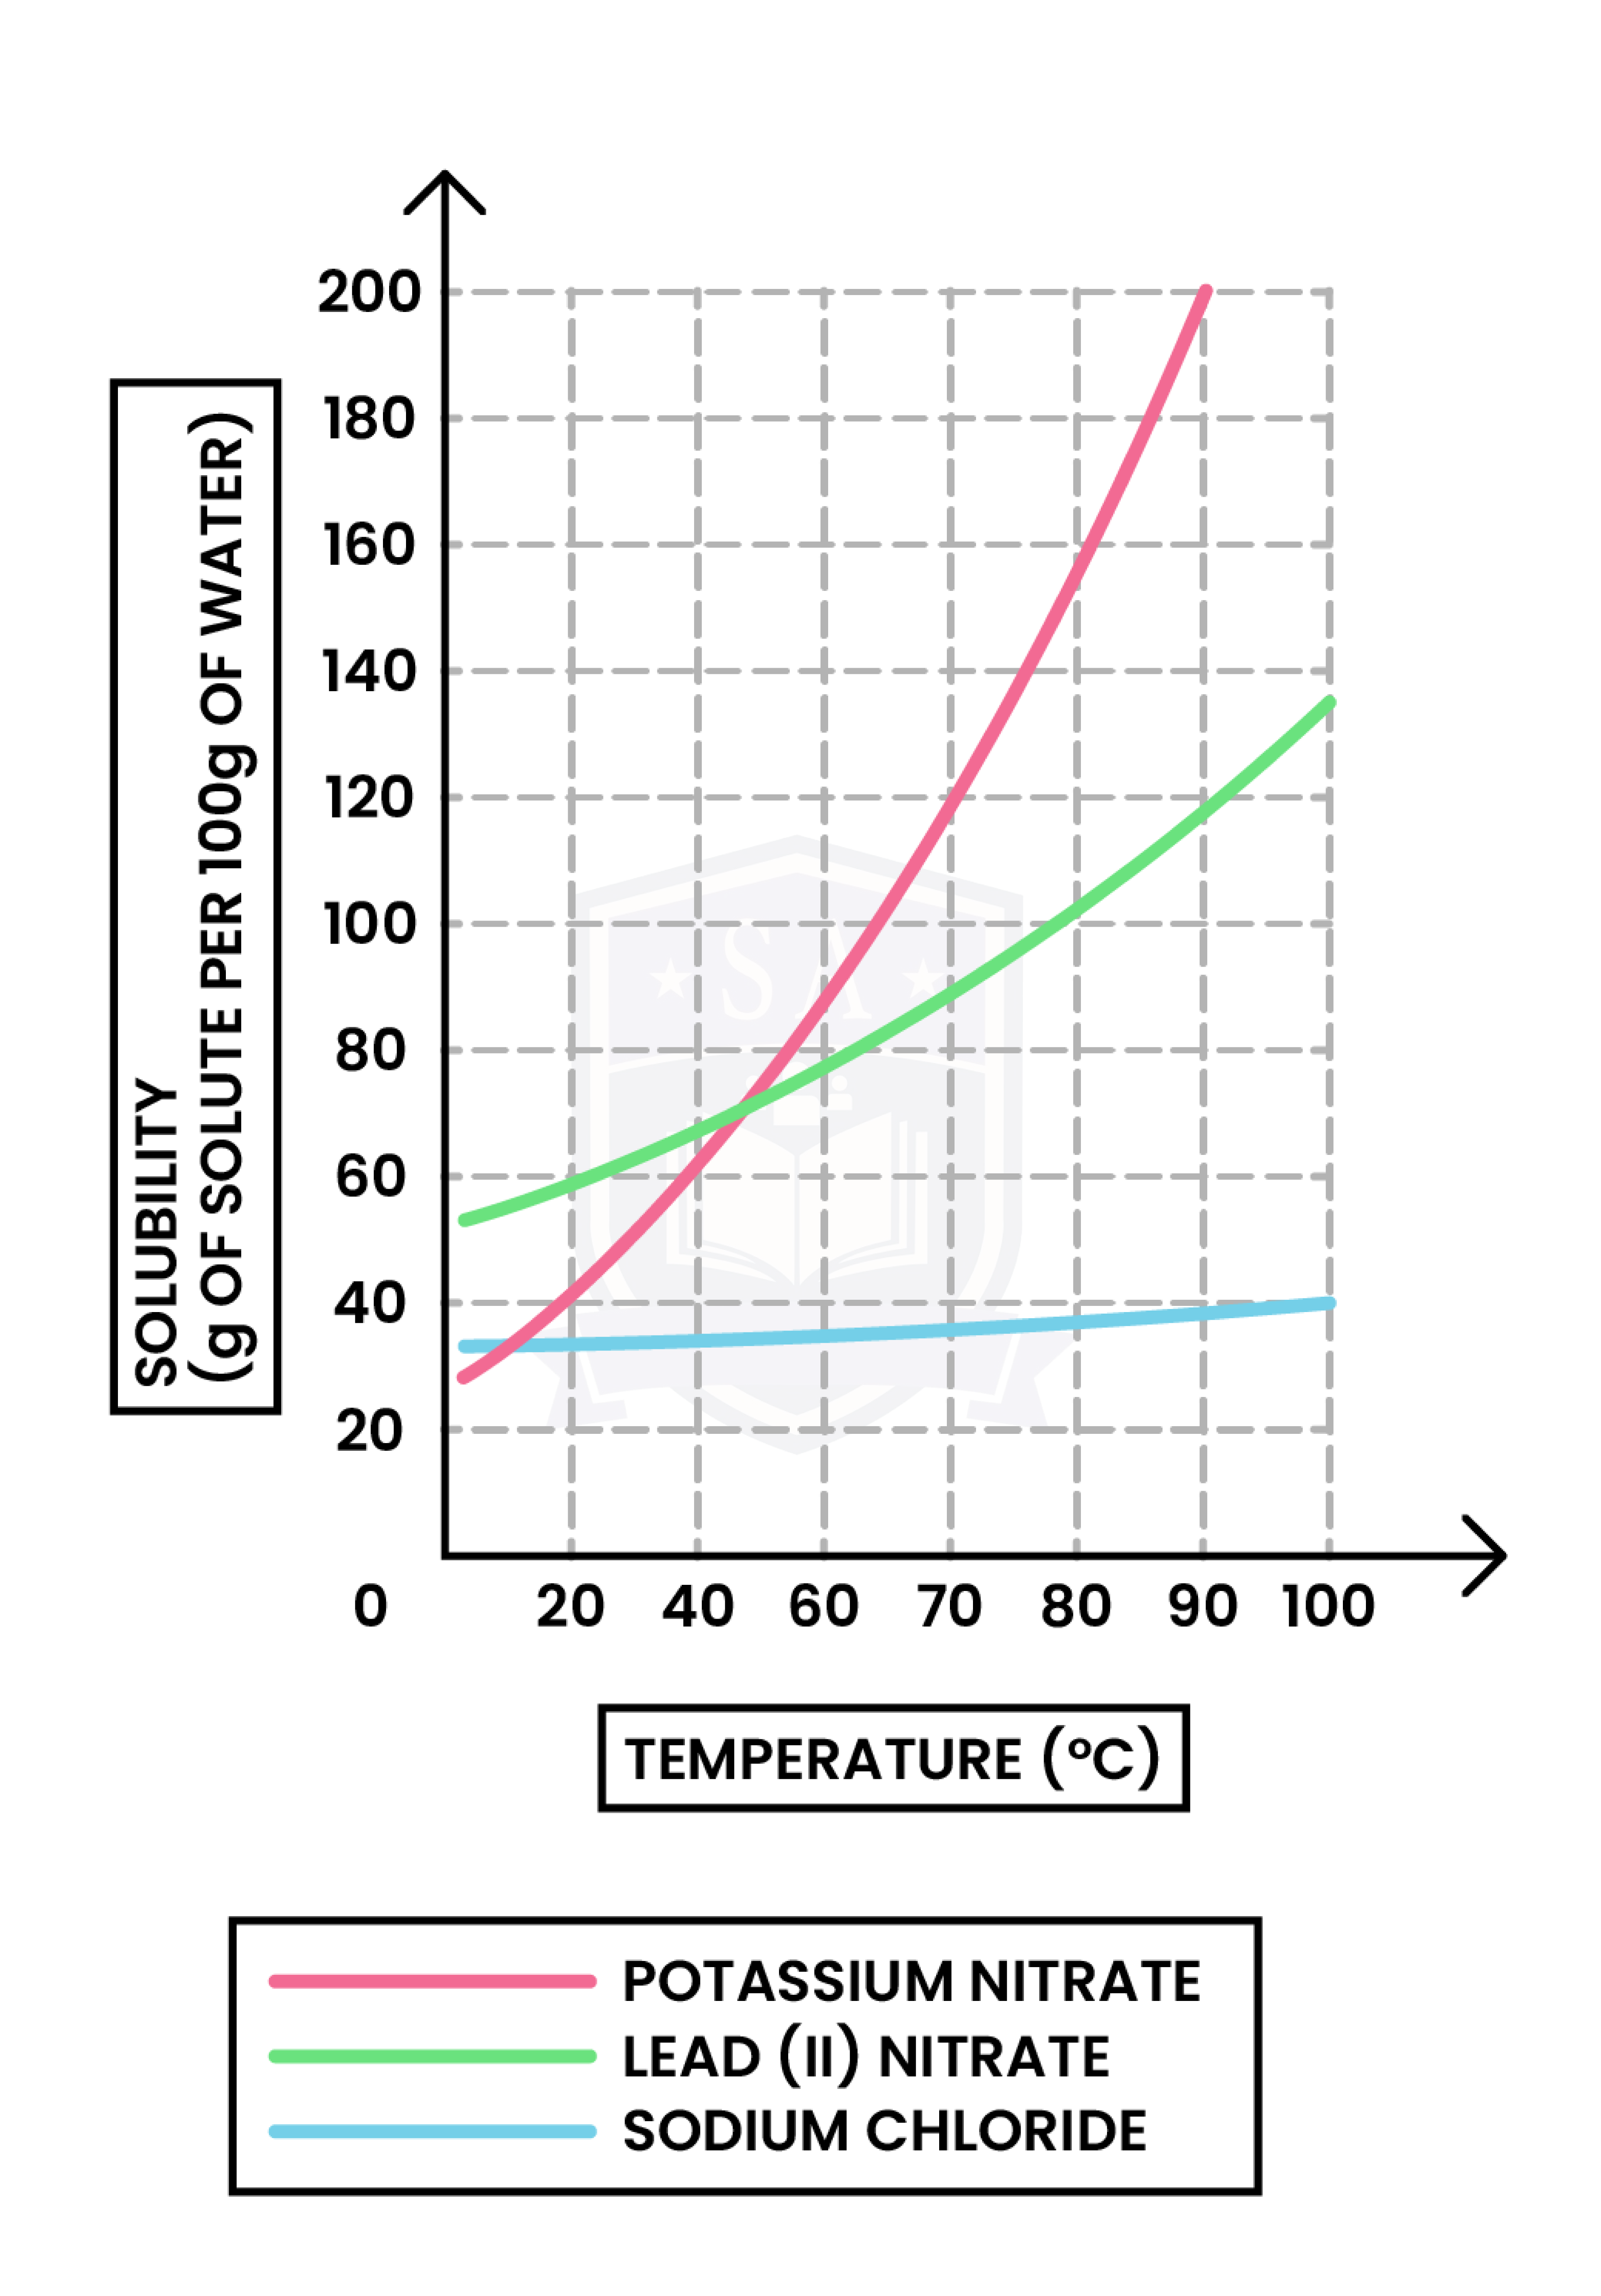
1.1.6C Understand how to plot and interpret solubility curves
x-axis: Temperature (in oC or Kelvin)
y-axis: Solubility (in g per 100g of water)
To plot a solubility curve:
- The saturation point at different temperatures should be determined first
- Saturation point is the maximum mass of solvent that can dissolve in 100g of water
Always remember:
- The readings on solubility curve are per 100g water, while the question might ask more than/multiples of 100g water
- When temperature increases:
- Solids become more soluble
- Gases become less soluble
1.1.7C Practical: investigate the solubility of a solid in water at a specific temperature
AIM
- To measure the solubility of a salt at different temperatures
EQUIPMENT LIST
- 250 cm3 beaker
- Thermometer
- Water bath
- Glass rod
- Digital mass balance
CHEMICALS REQUIRED
- Deionised water
- A powdered solid (e.g.sodium chloride)
METHOD
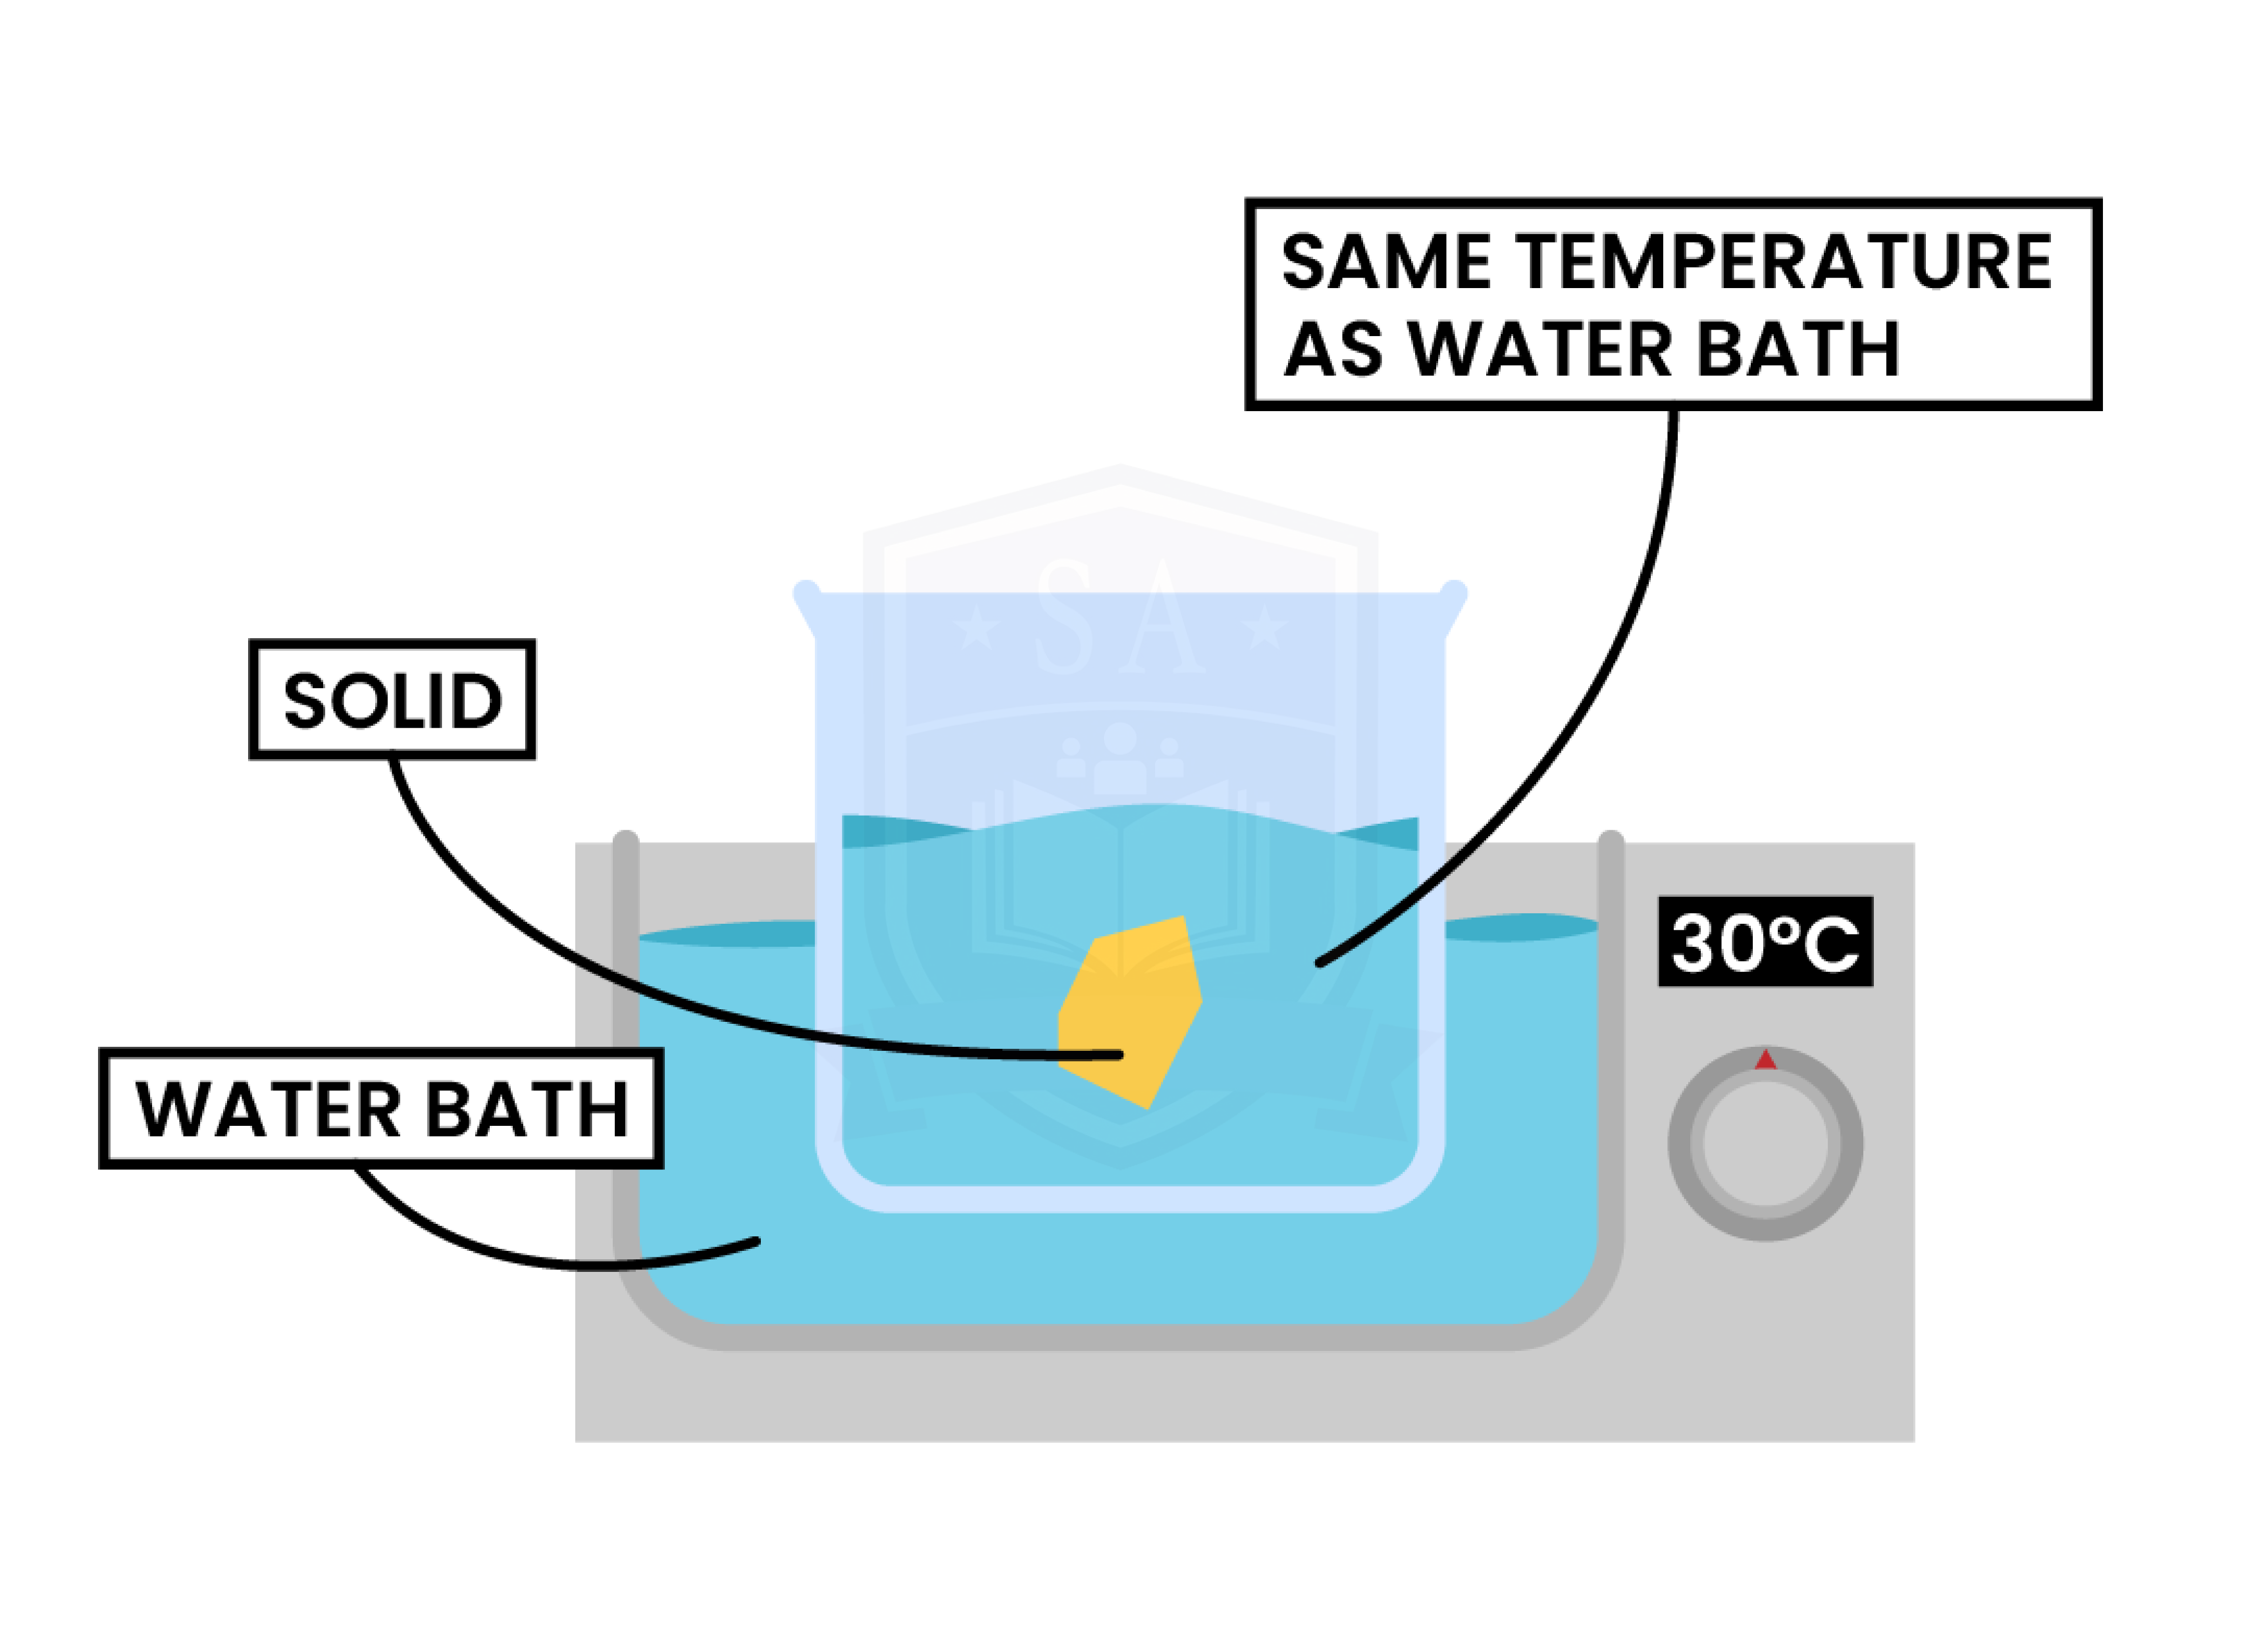
- Set the water bath to the desired temperature.
- Pour 200 cm3 of deionised water into a 250 cm3 beaker.
- Place the beaker into the water bath. Keep the thermometer in the beaker to ensure the temperature stays constant throughout the experiment.
- Wait for the temperature of water to stabilise at the desired temperature.
- Add known masses of sodium chloride (NaCl) bit by bit until it stops dissolving and remains solid in the solution.
- Record the mass of solid that was soluble.
- Repeat steps 1-6 with the water at different temperatures.
KEY POINTS
- If the solid is very soluble, the solubility could be investigated by timing how long it takes a known mass of solid to dissolve at each temperature.
- A larger mass of solid should dissolve at higher temperatures
- To compare the solubility of different solids, keep the temperature of the water the same in each trial but use different solids.
SAFETY PRECAUTIONS
- Avoid touching hot parts of the water bath and handle the beaker with care when it is hot.
- Be careful with the glassware and clear up any broken glass immediately.
- All chemicals must not be ingested.
Result Table

RESULT GRAPH
- Calculate the solubility of NaCl at each temperature
- Solubility = mass of NaCl dissolved in water ÷ mass of water x 100
- Plot a graph
- x-axis: temperature (in oC or Kelvin)
- y-axis: solubility (in g per 100g of water)

