REVISION NOTES
1.1.1 Use the following units: kilogram (kg), metre (m), metre/second (m/s), metre/second2 (m/s2), newton (N), second (s) and newton/kilogram (N/kg)
Quantity
Symbol
SI Unit
Mass
m
Kilograms (kg)
Distance
d
Metres (m)
Velocity
v
Metres per second (m/s)
Acceleration
a
Metres per second squared (m/s2)
Force
F
Newtons (N)
Time
t
Seconds (s)
Gravitational Field Strength
g
Newtons per kilogram (N/kg)
1.1.2 Use the following units: newton metre (Nm), kilogram metre/second (kg m/s)
Moments
M
Newton metre (Nm)
Momentum
p
Kilogram metre per second (kg m/s)
1.1.3 Plot and explain distance−time graphs
1.1.4 Know and use the relationship between average speed, distance moved and time taken:
1.1.5 Practical: investigate the motion of everyday objects such as toy cars or tennis balls
Apparatus needed:
Method:
Control variables:
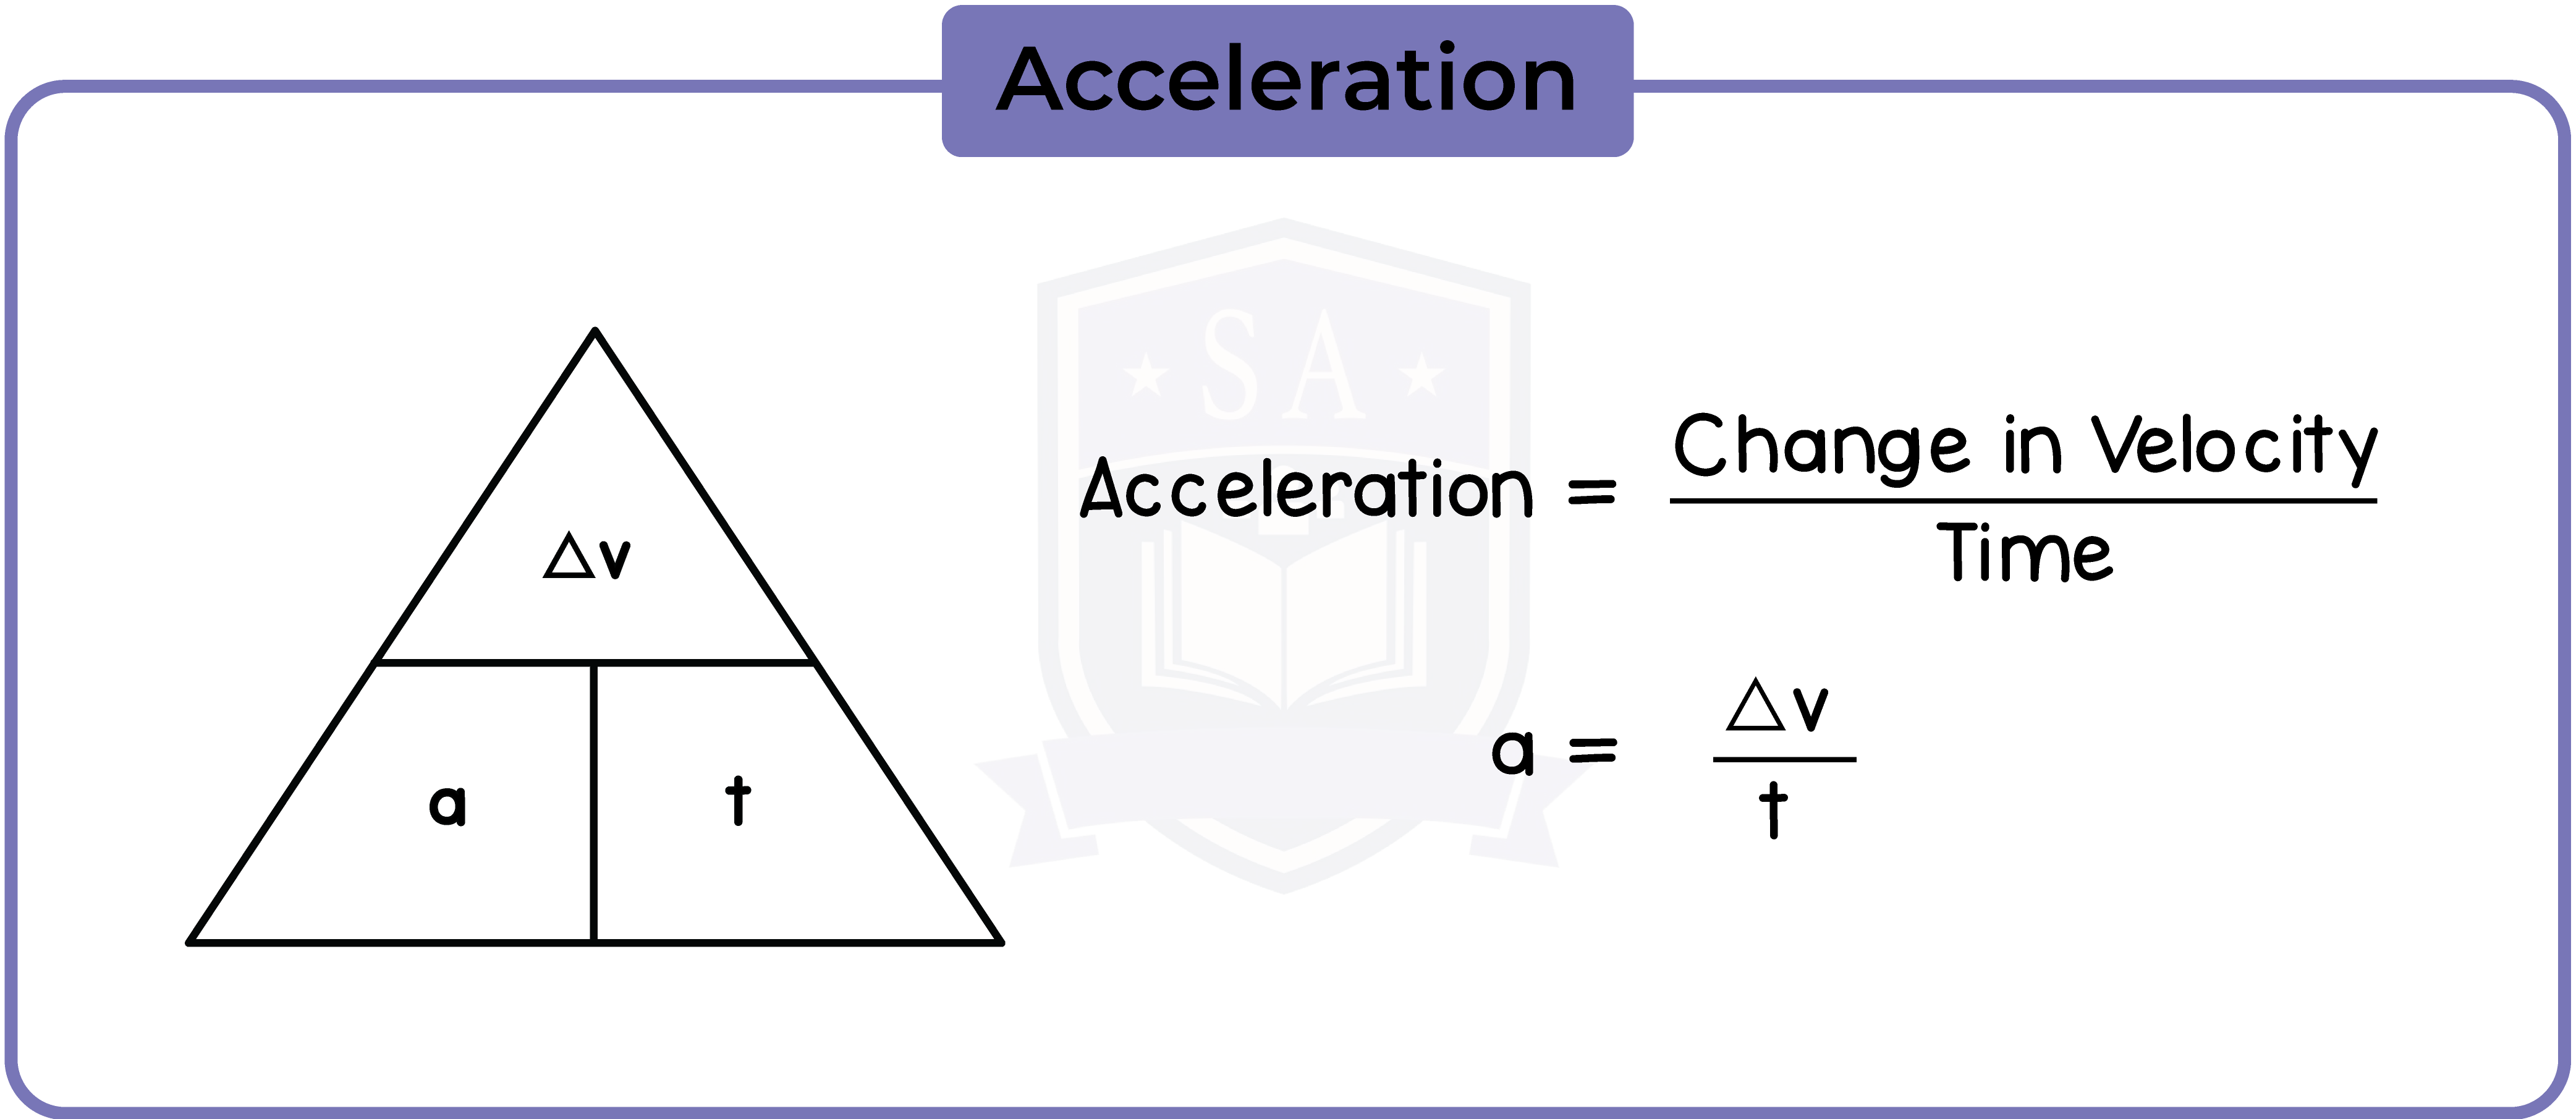
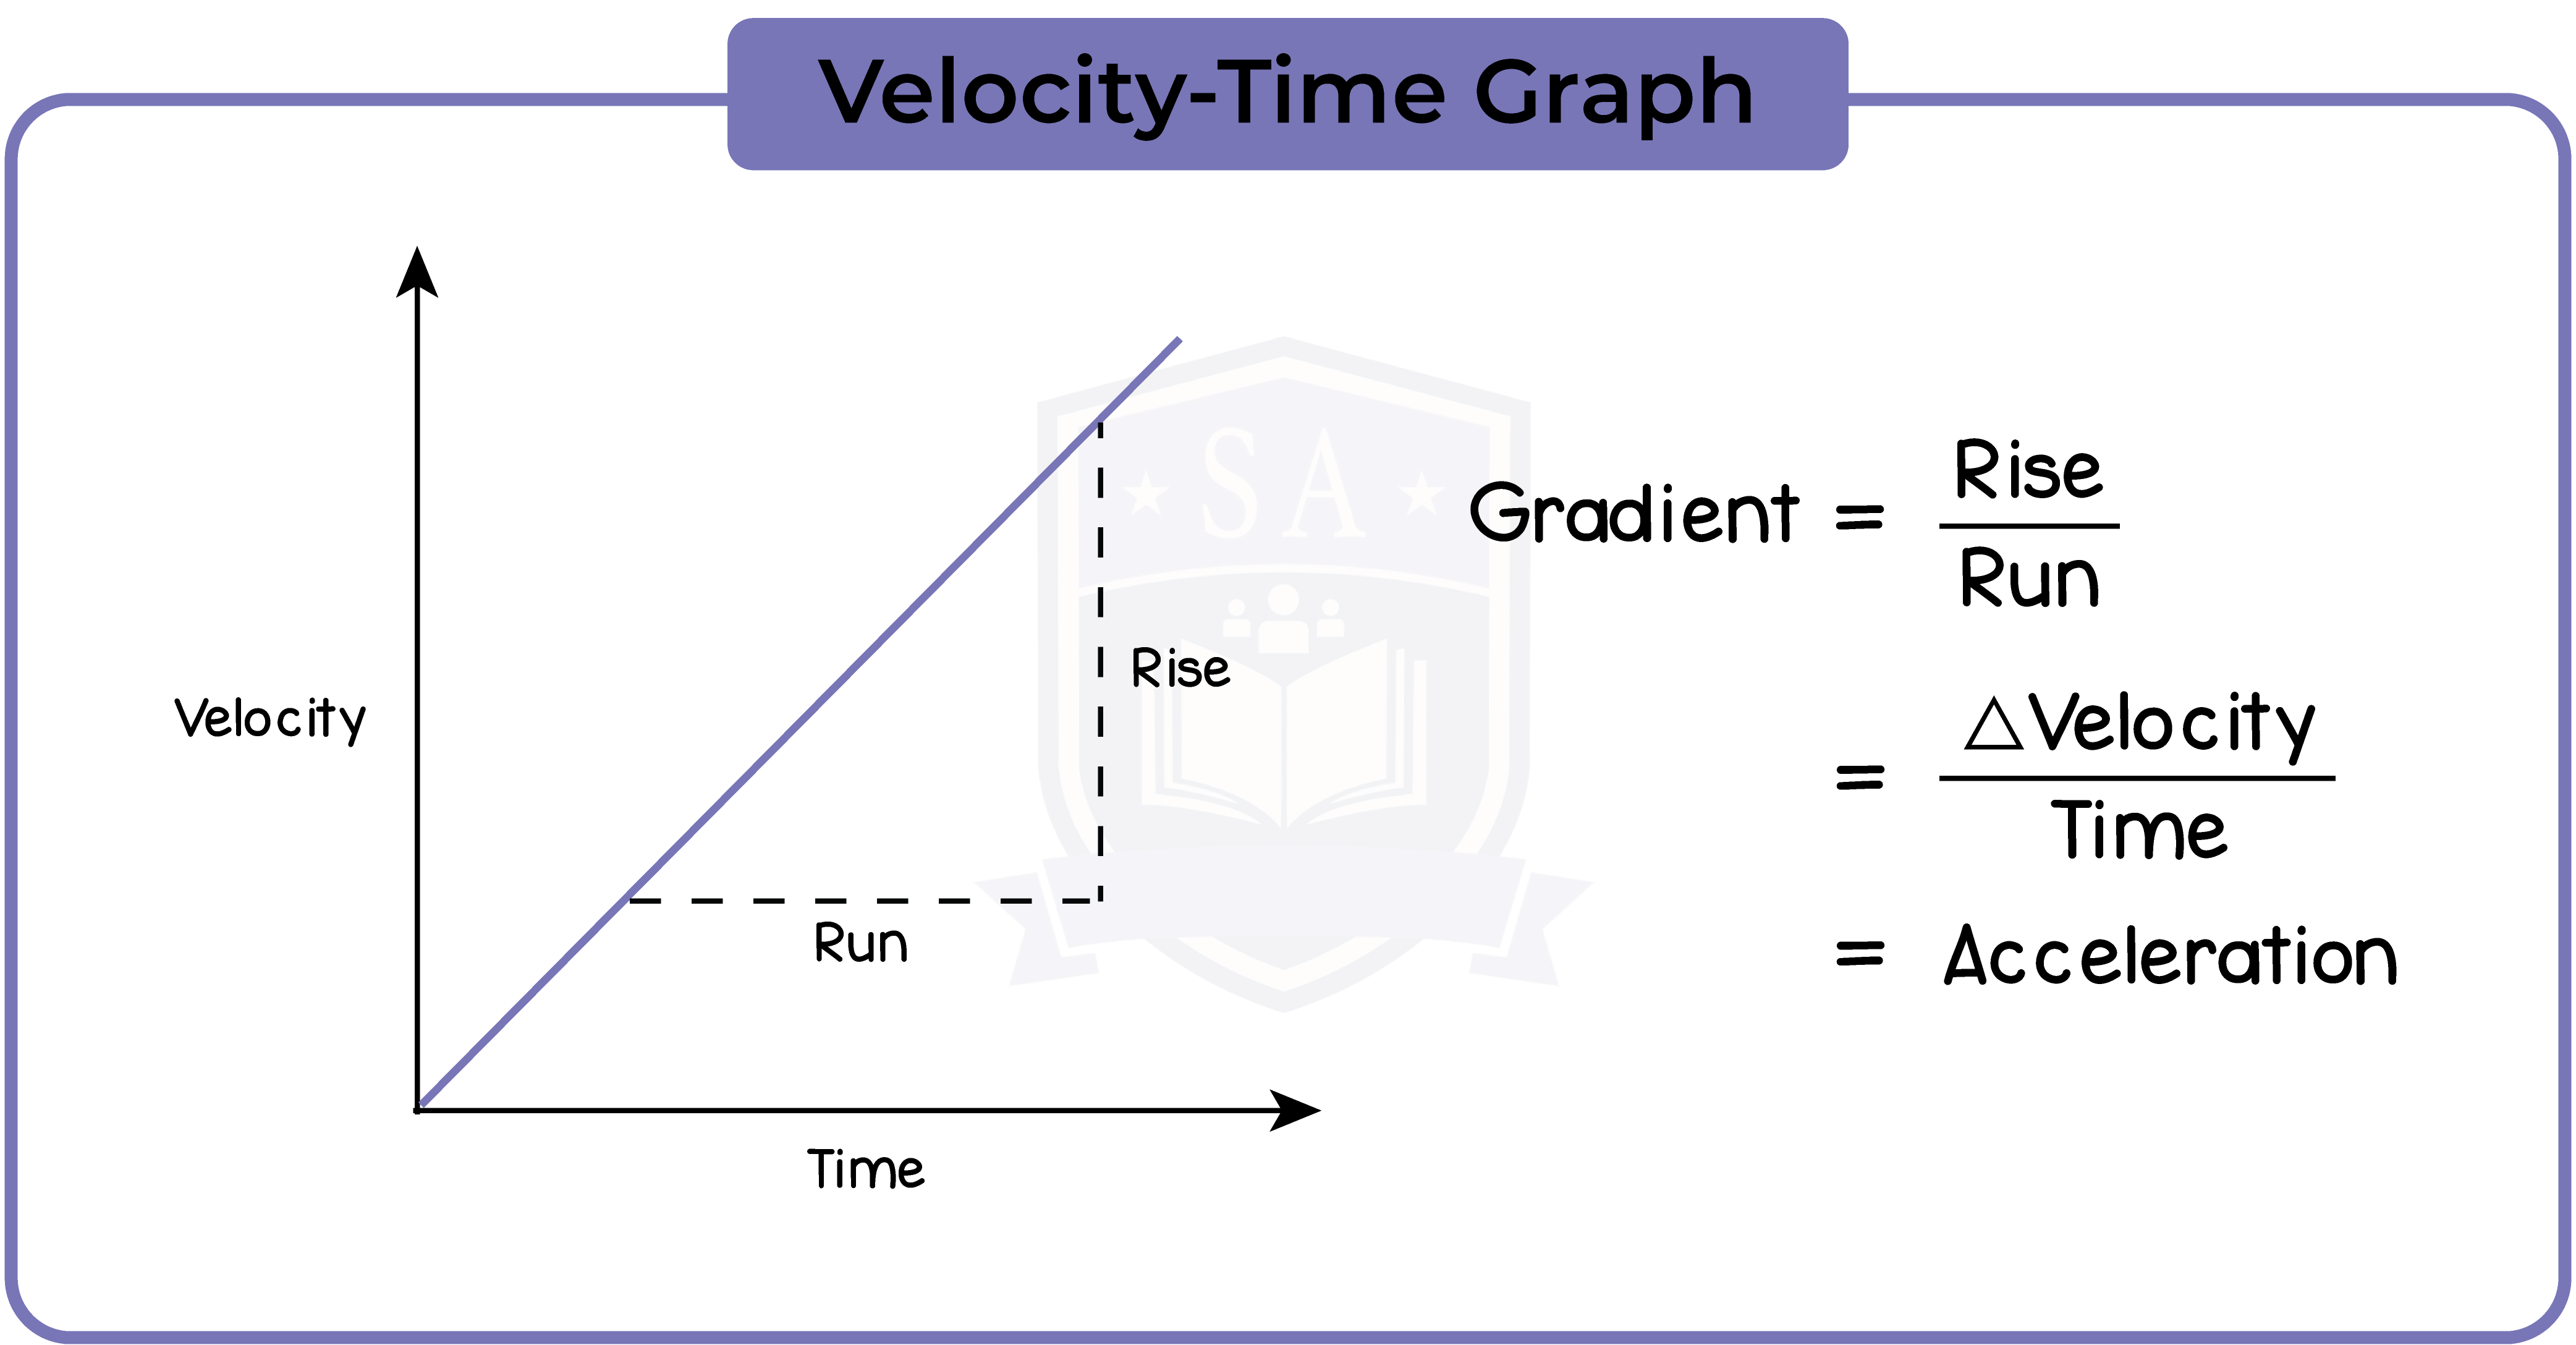
1.1.6 Know and use the relationship between acceleration, change in velocity and time taken: acceleration = change in velocity/time taken
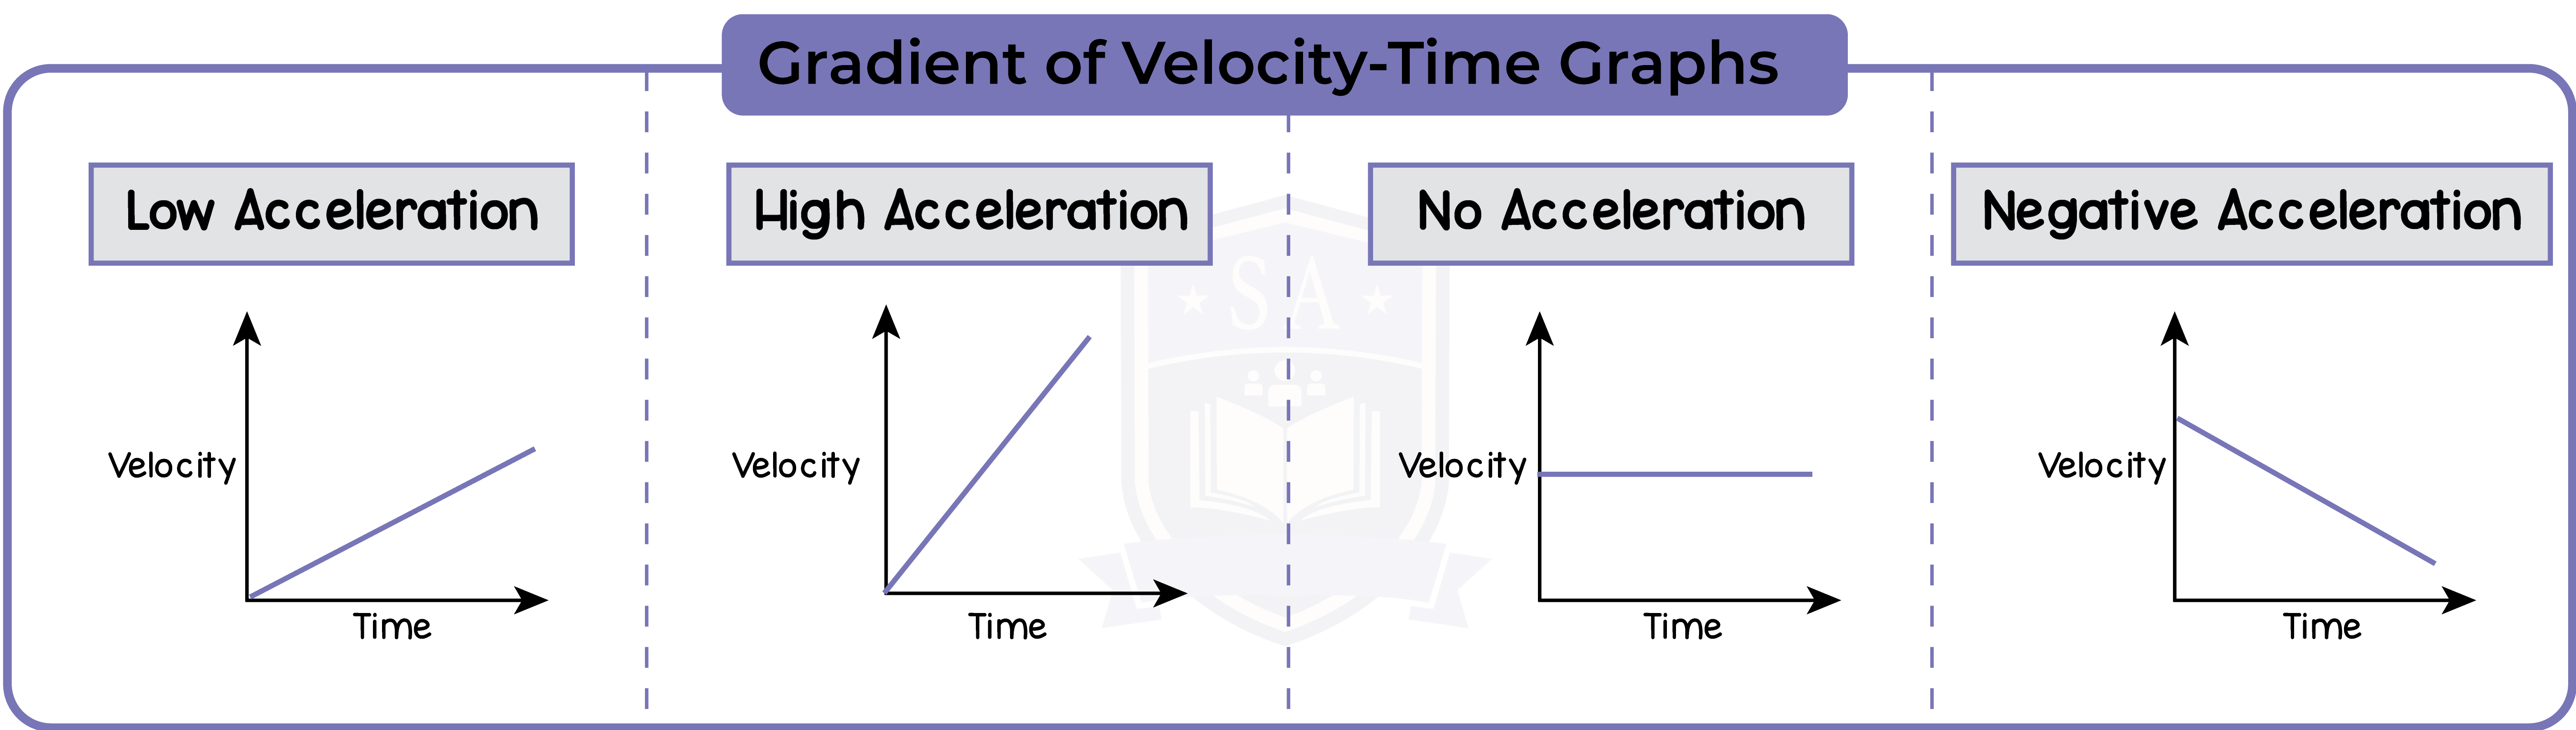
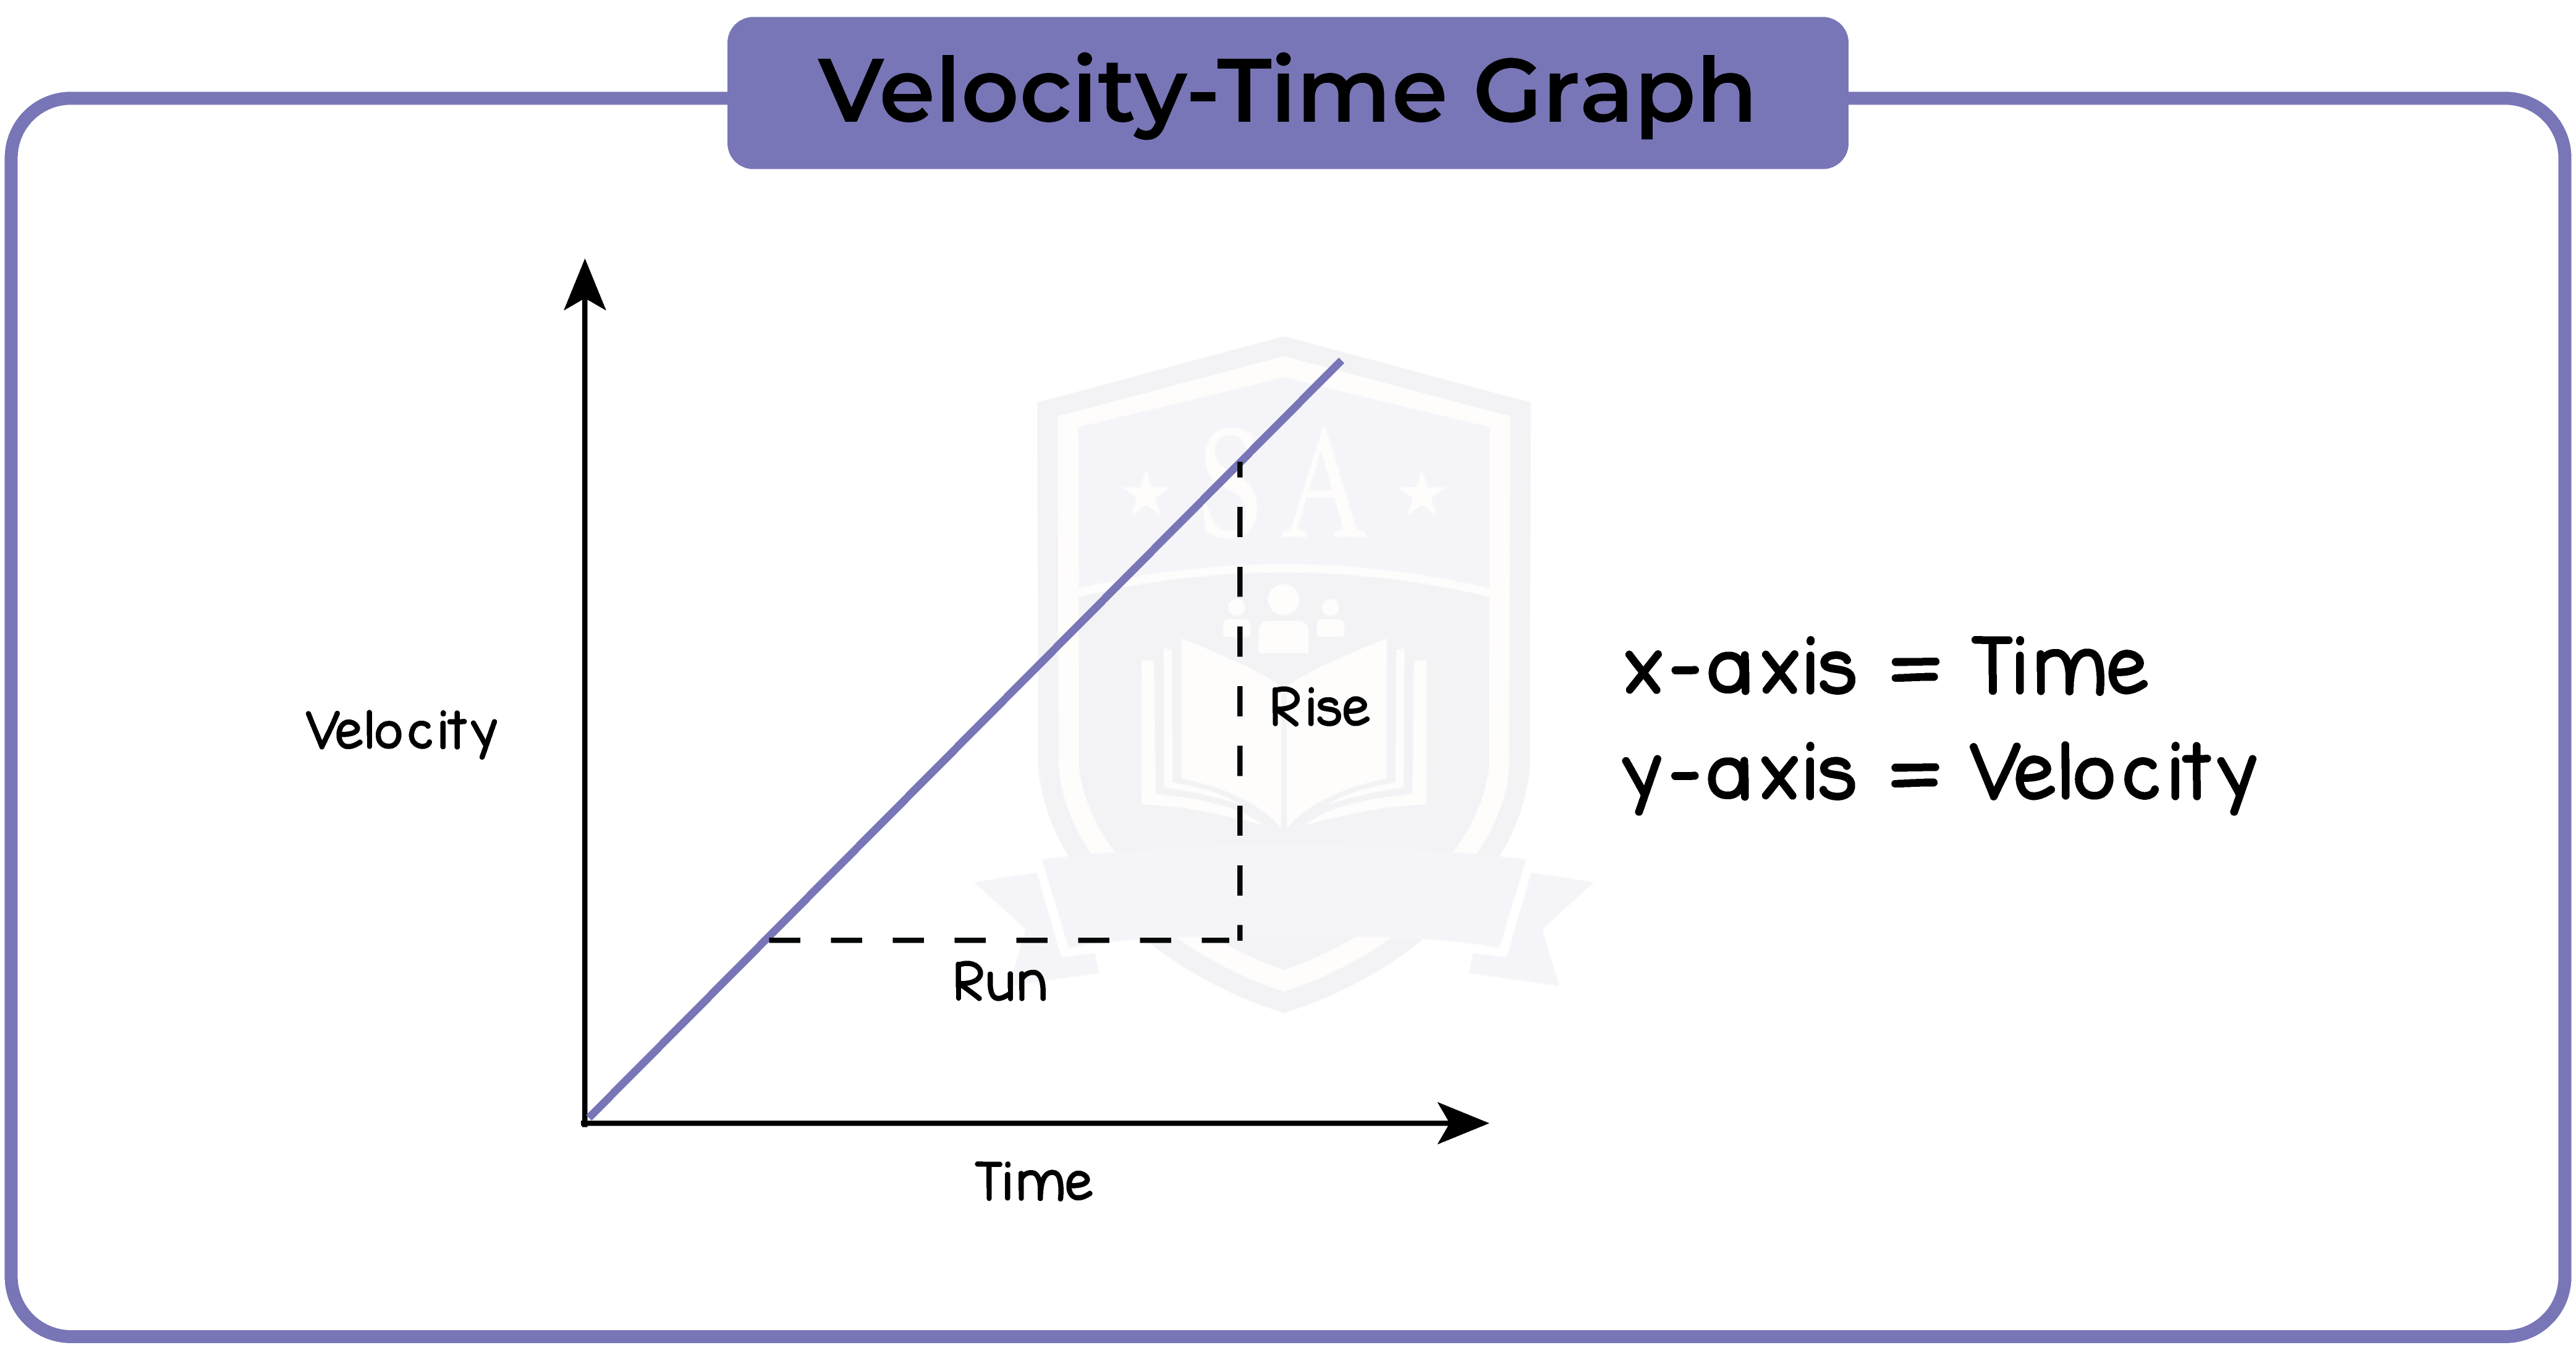
1.1.7 Plot and explain velocity−time graphs
The area under the the graph is equal to the distance travelled.
1.1.8 Determine acceleration from the gradient of a velocity−time graph
1.1.9 Determine the distance travelled from the area between a velocity−time graph and the time axis
1.1.10 Use the relationship between final speed, initial speed, acceleration and distance moved:
1.1 Movement and Position
1.2 Forces, Movement, Shape and Momentum
2.1 Mains Electricity
2.2 Energy and Voltage in Circuits
2.3 Energy Charge
3.1 Properties of Waves
3.2 The Electromagnetic Spectrum
3.3 Light and Sound
4.1 Energy Transfers
4.2 Work and Power
4.3 Energy Resources and Electricity Generation
5.1 Density and Pressure
5.2 Change of State
5.3 Ideal Gas Molecules
8.1 Motion In The Universe
8.2 Stellar Evolution
8.3 Cosmology
Contact Studia