REVISION NOTES
6.1.1 Use different methods of presenting data
Types of Data
1) Discrete data takes an exact value.
For example: Age
Presentation of Data: Stem-and-leaf, Frequency Table
Statistical Diagram: Histogram, Cumultaive Frequency
2) Continuous data takes a range of values.
For example: Height
Presentation of Data: Frequency Table
6.1.2 Use appropriate methods of tabulation to enable the construction of statistical diagrams
6.1.3 Interpret statistical diagrams
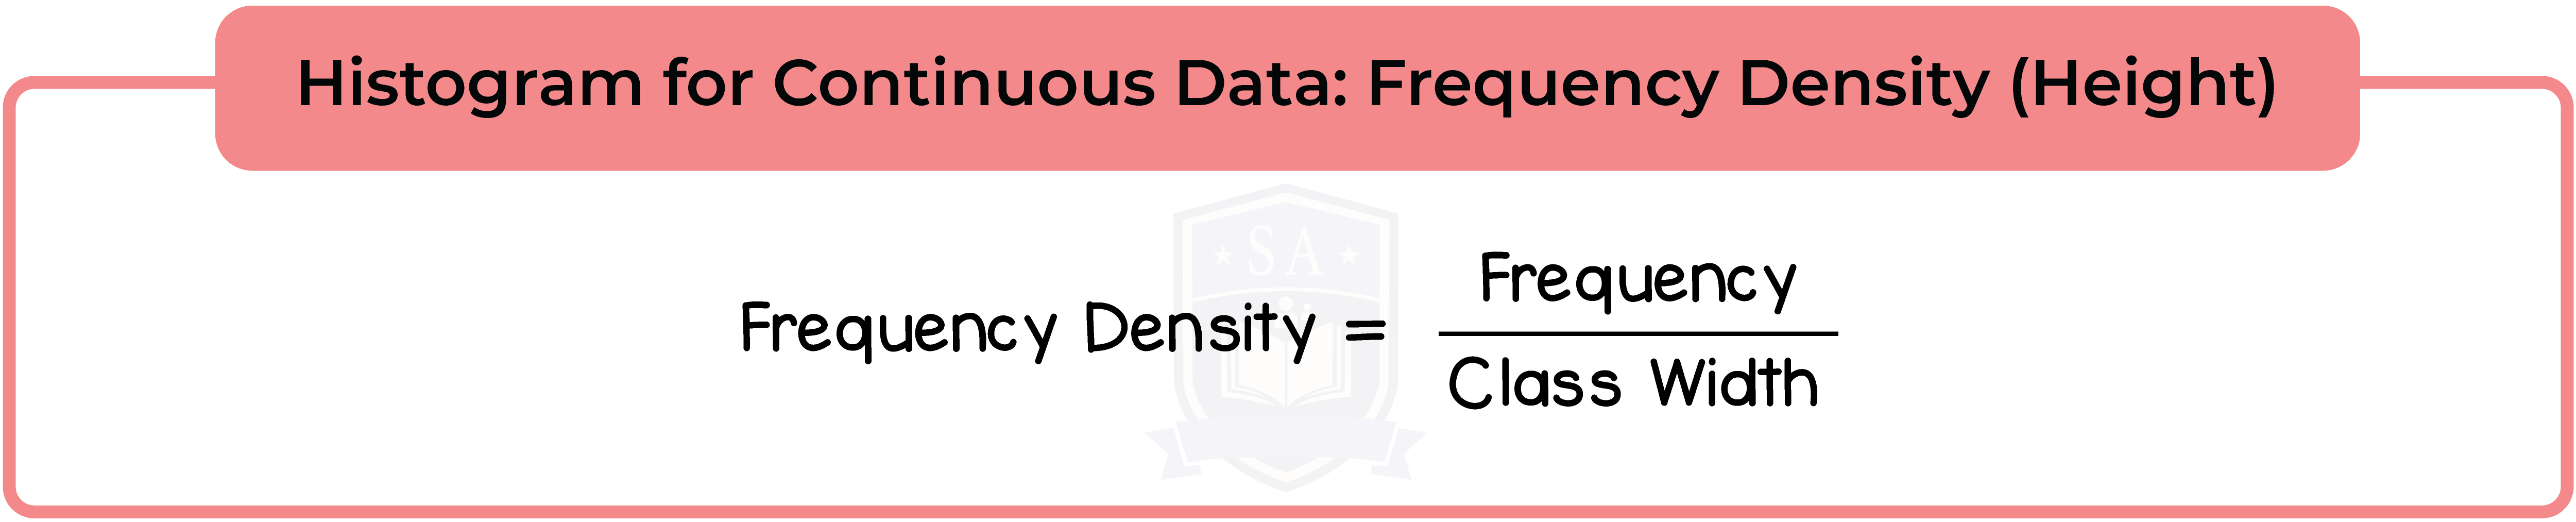
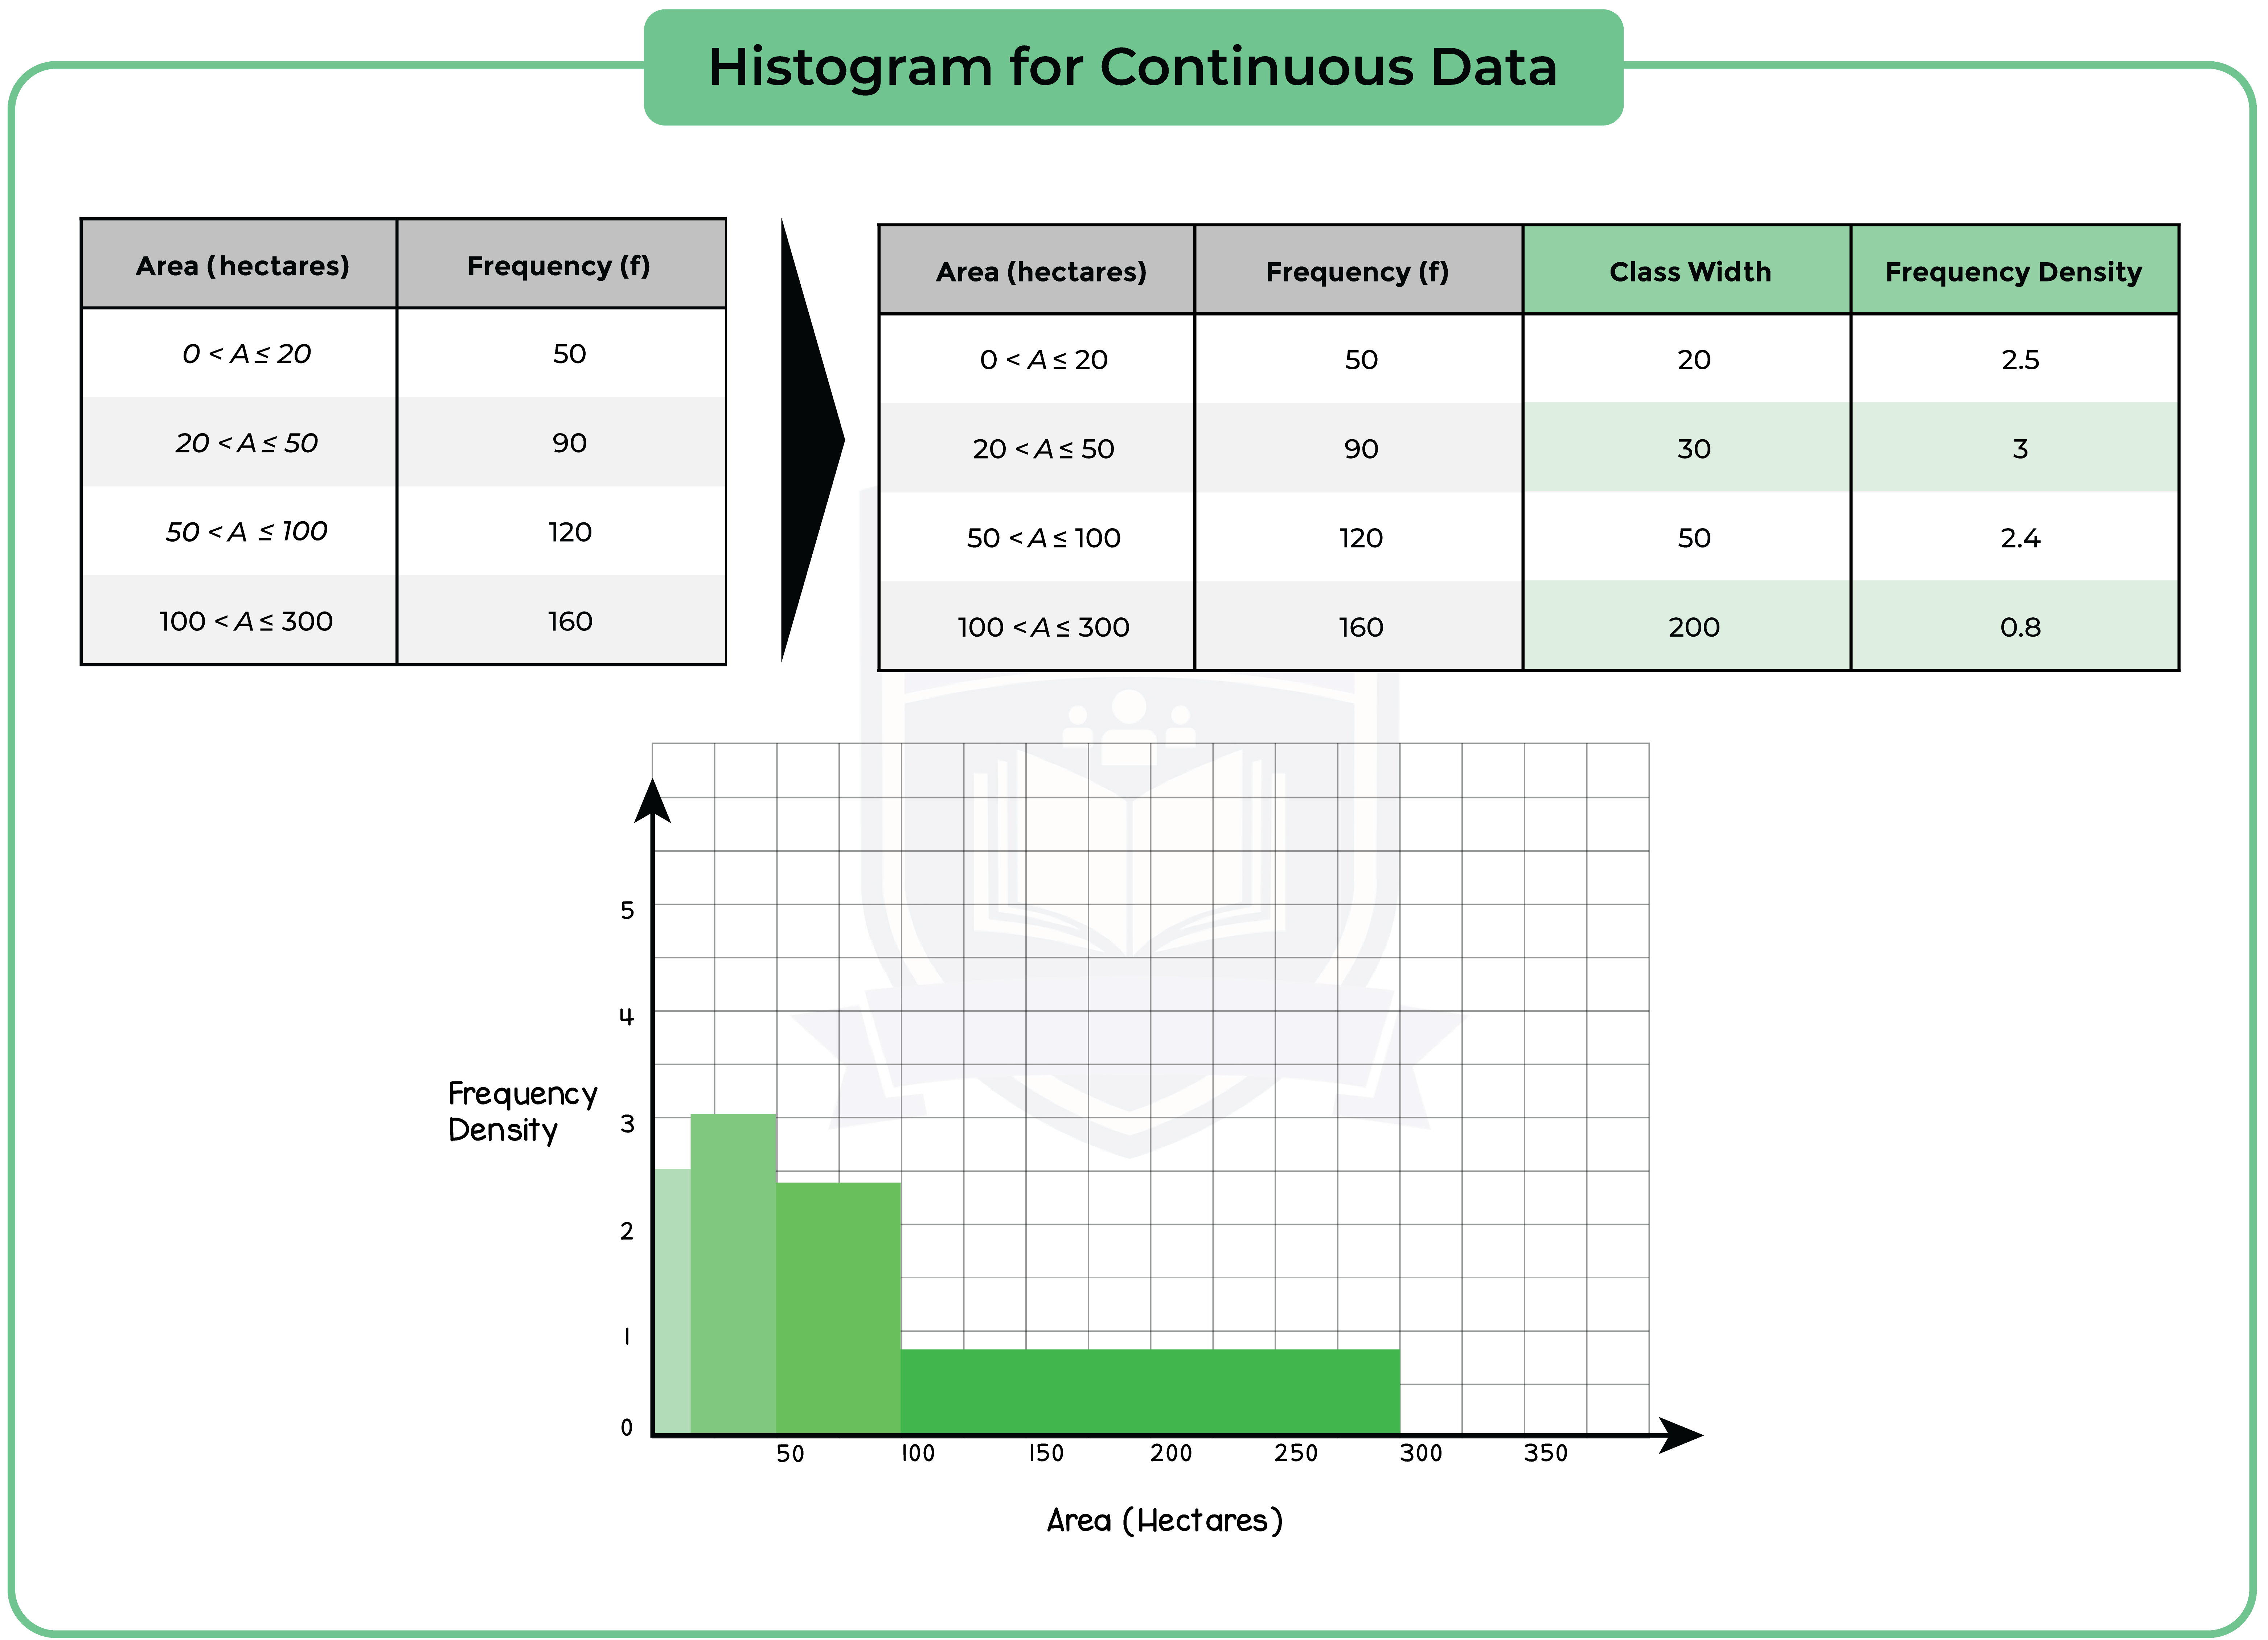
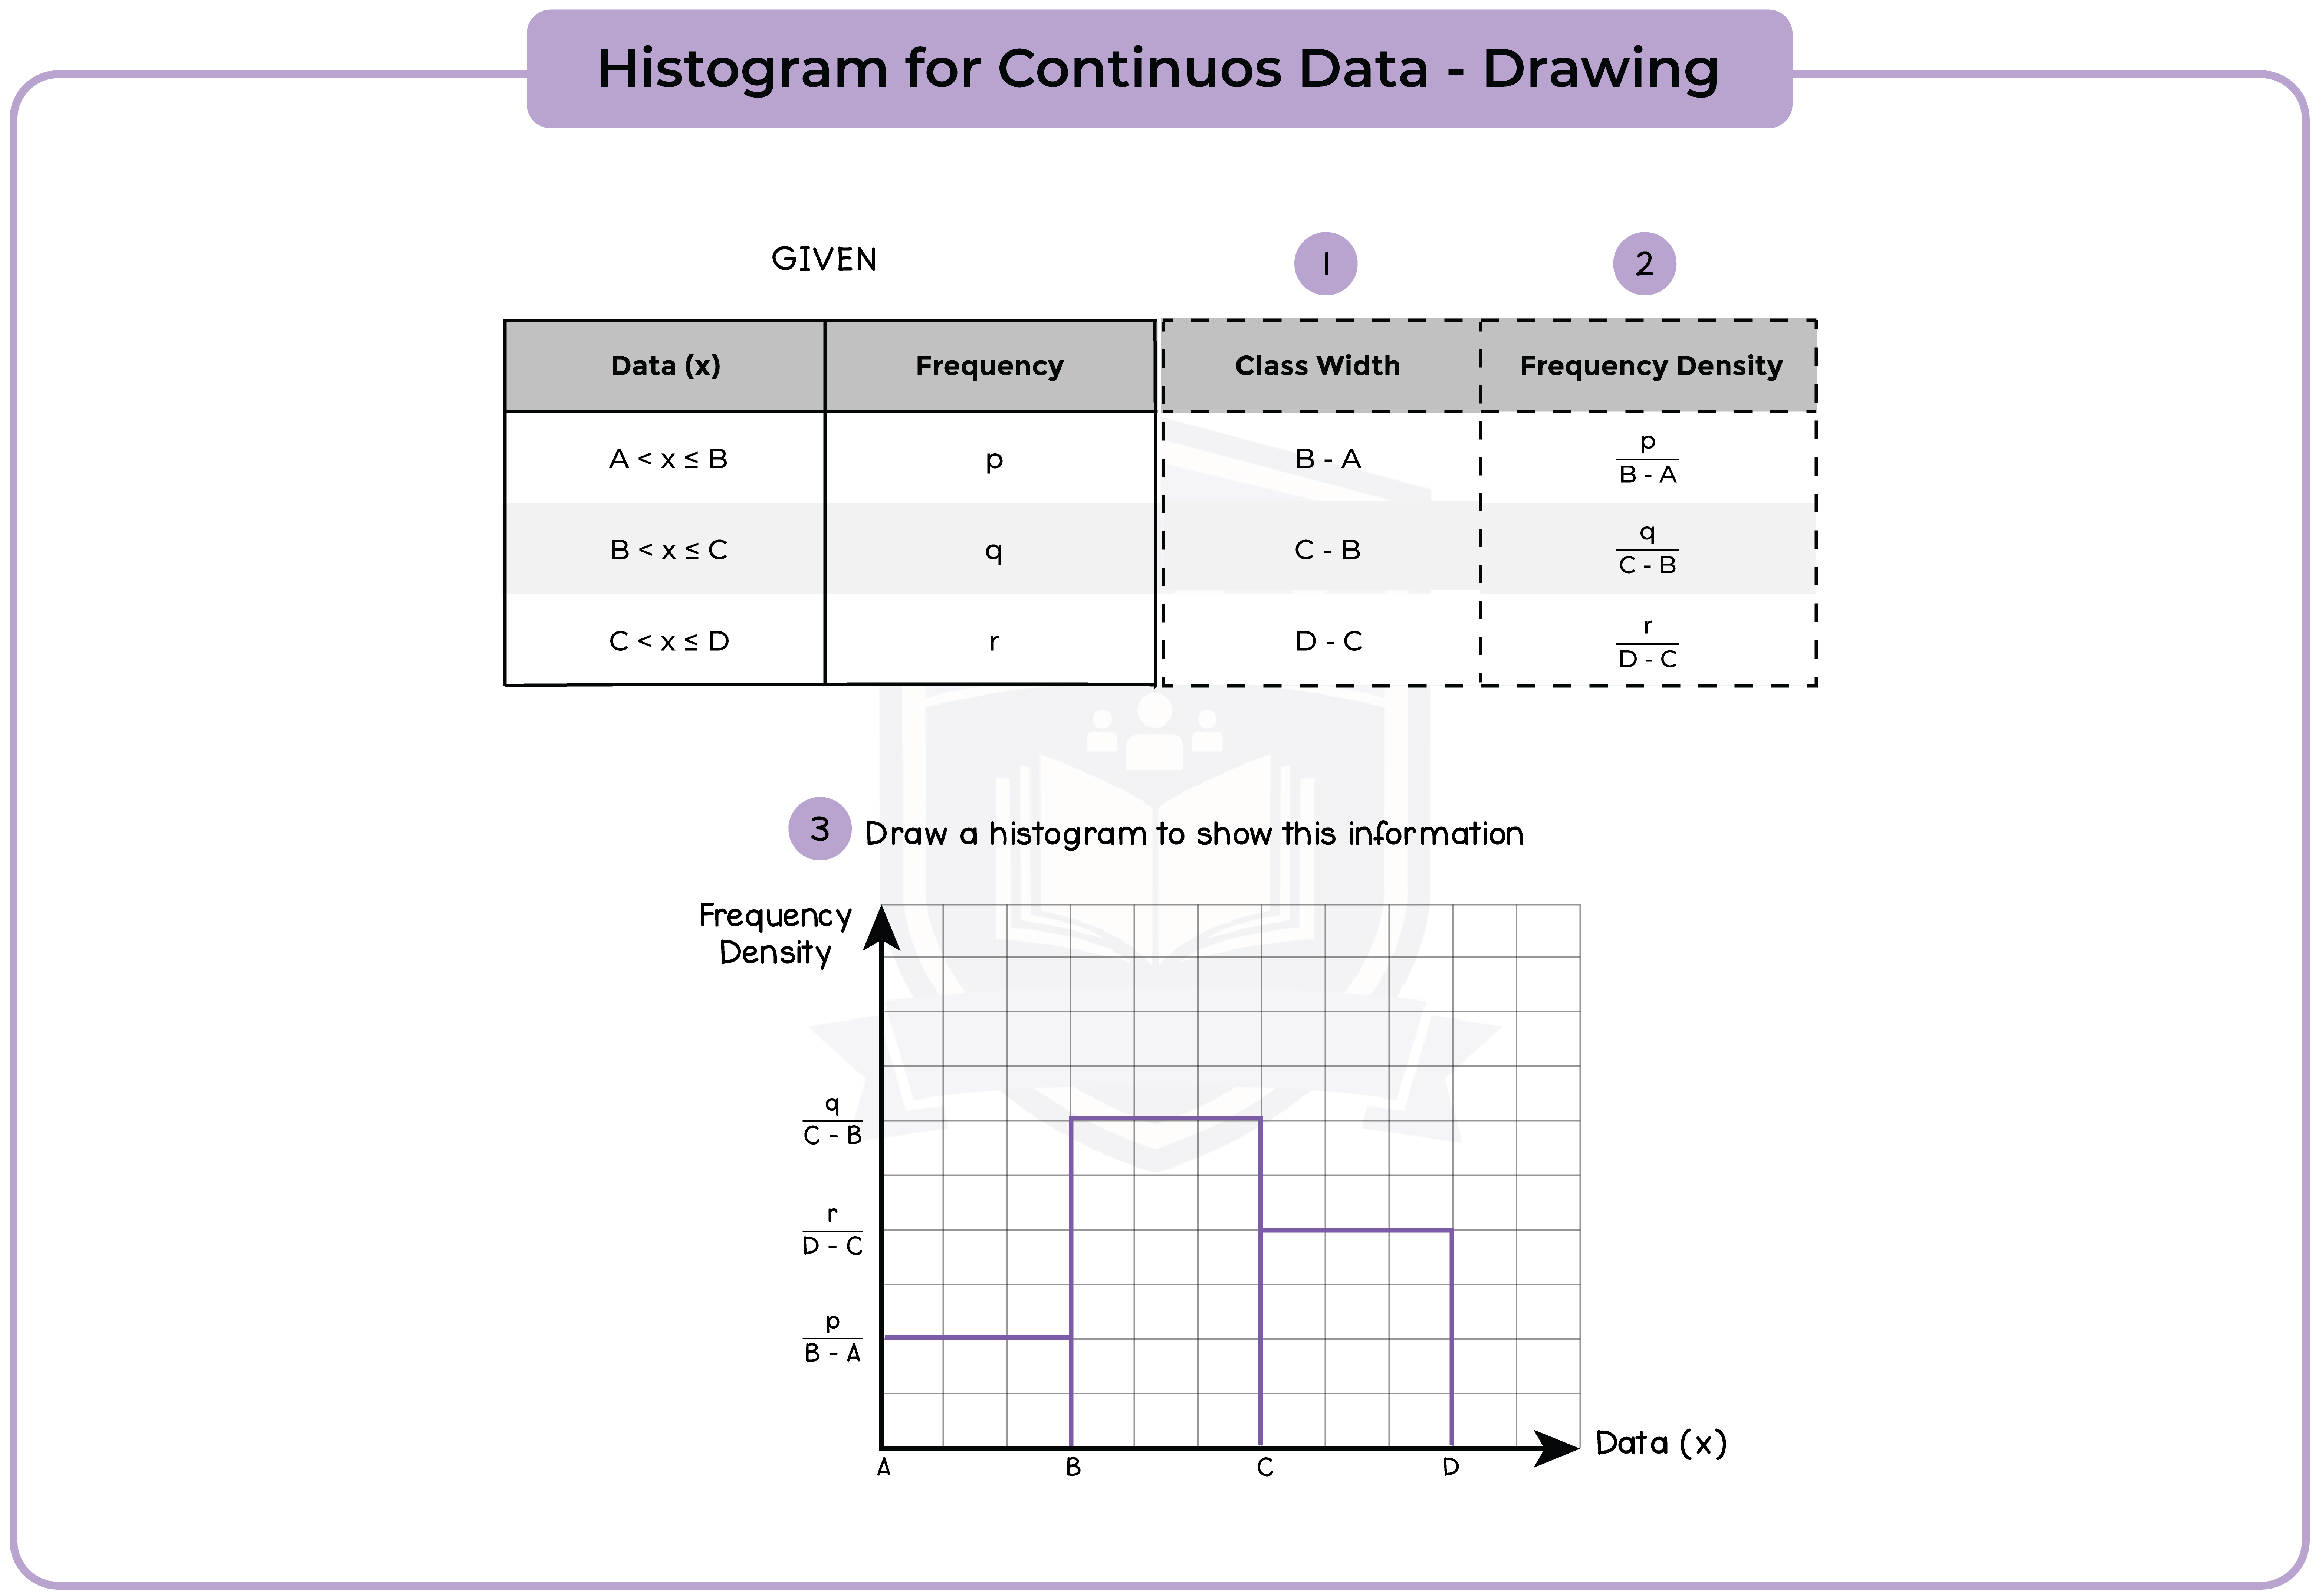
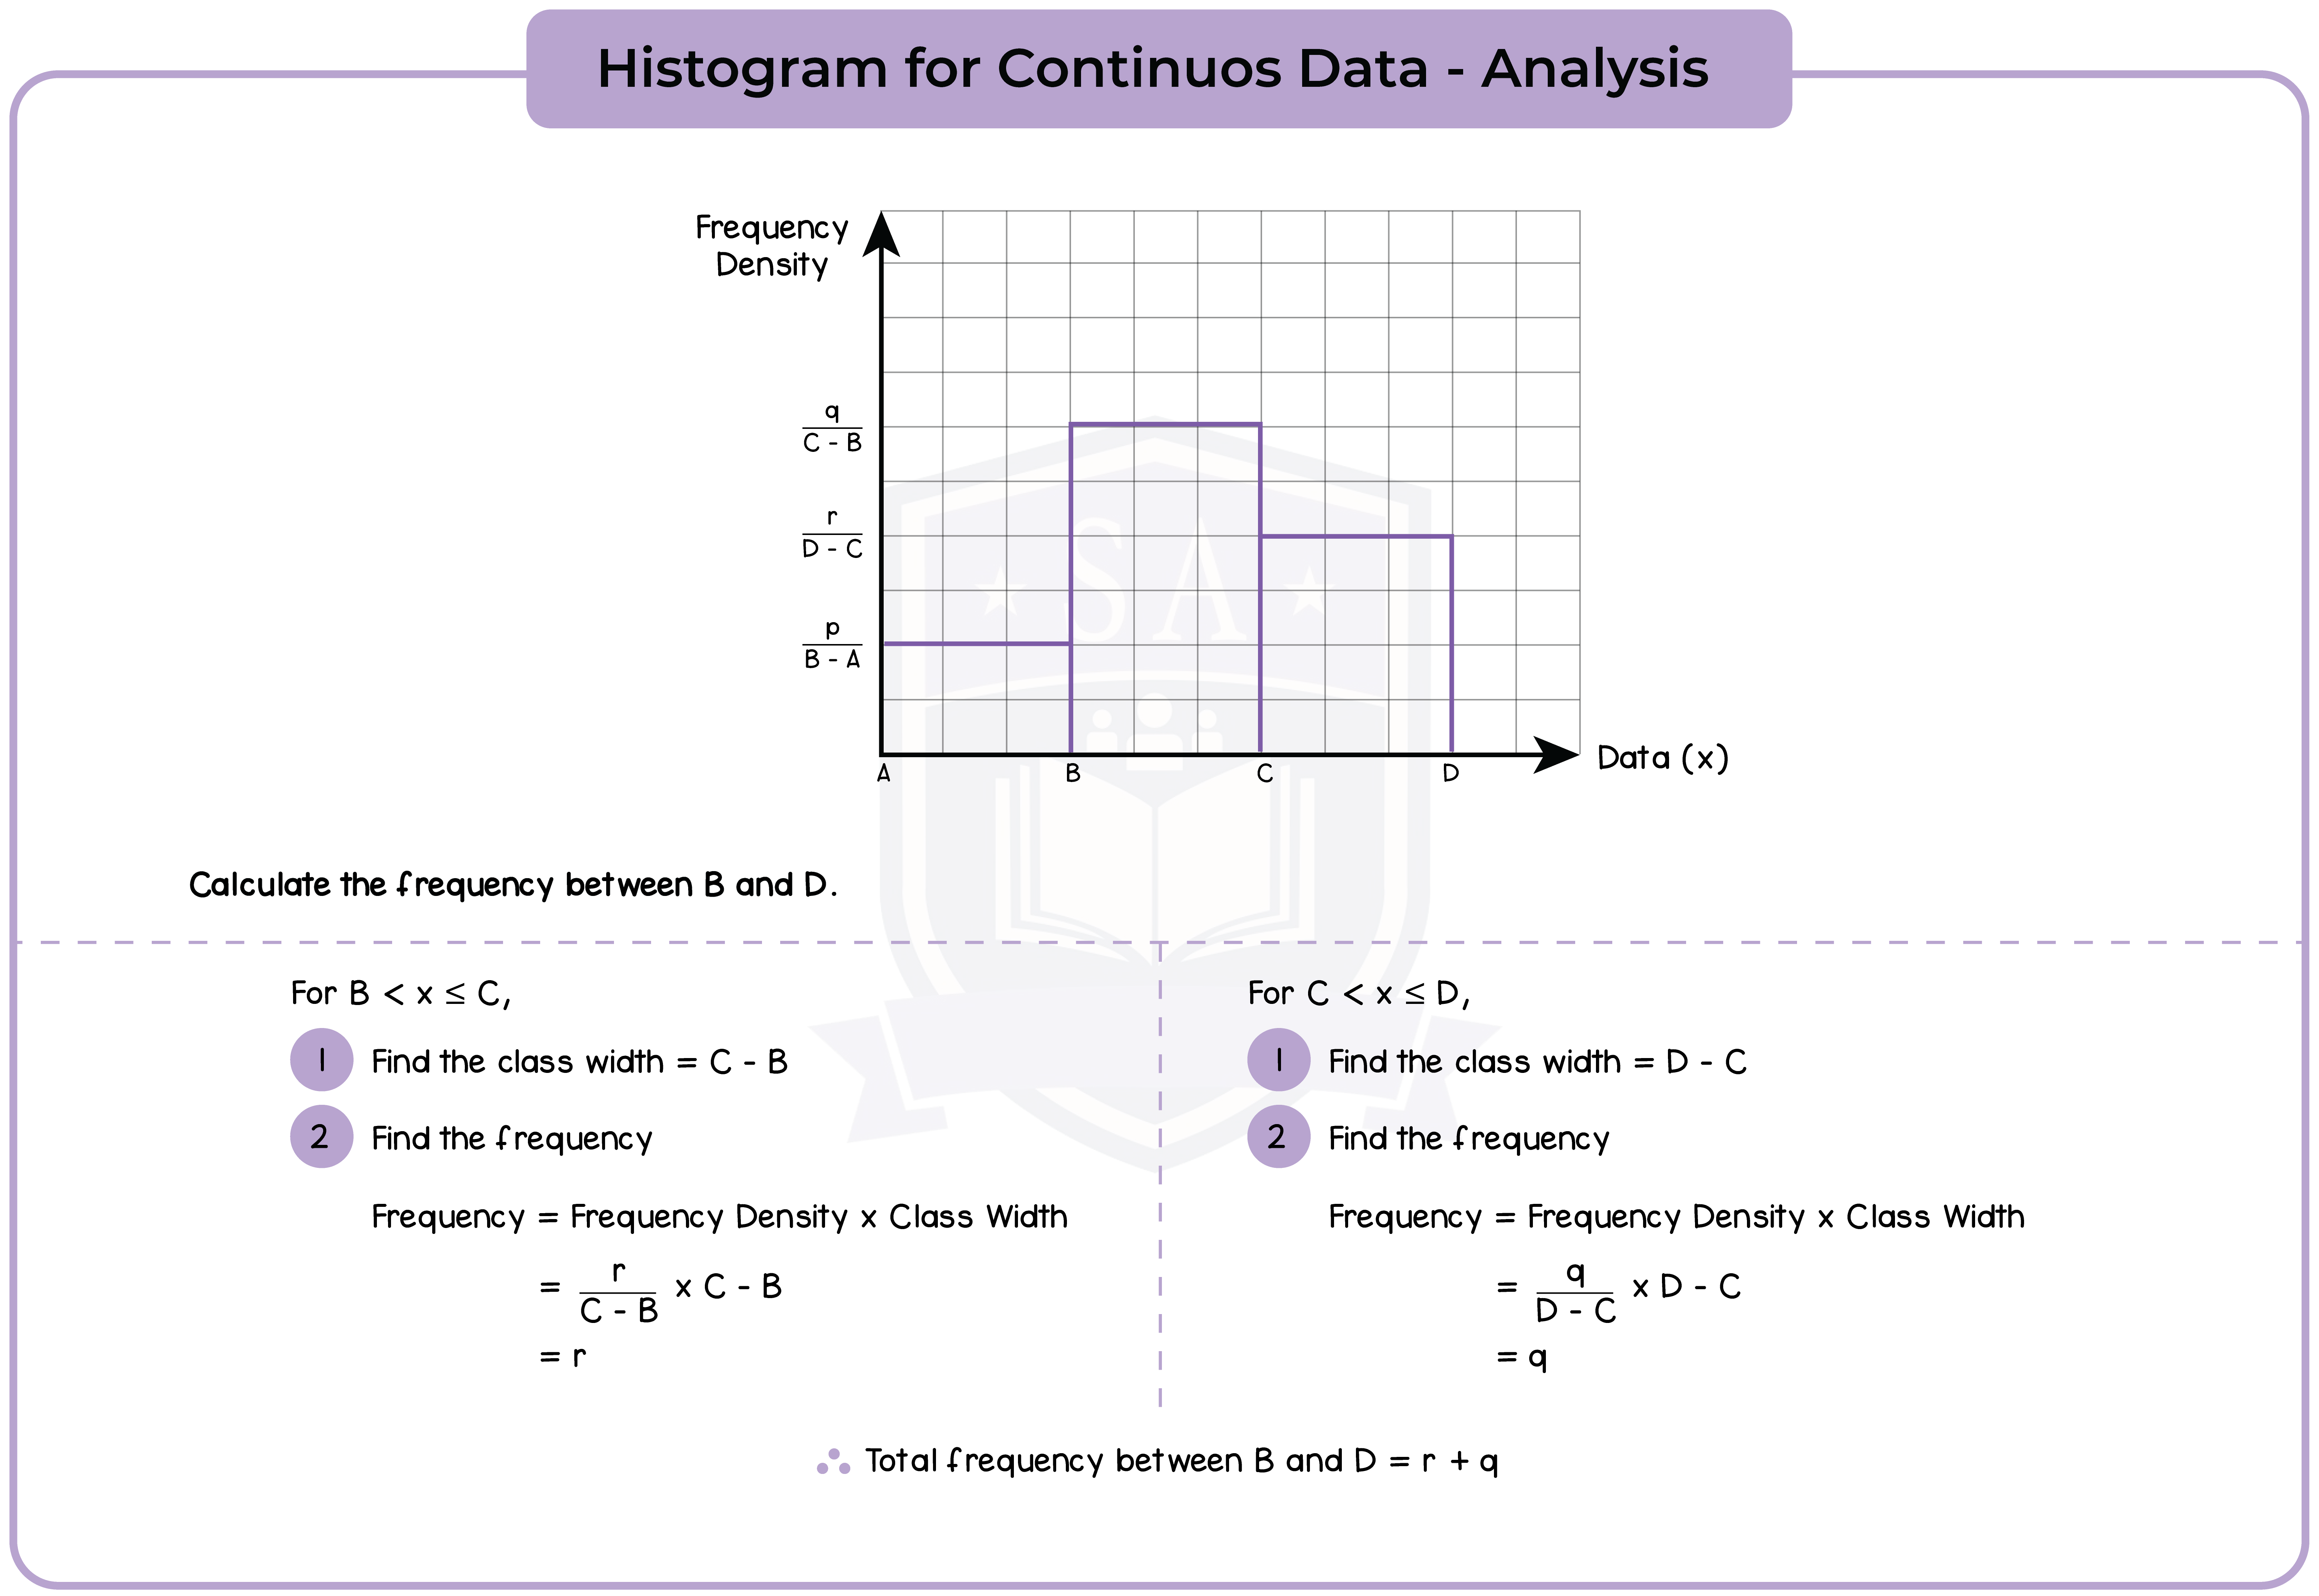
6.1.4 Construct and interpret histograms (Higher Tier Only)
A histogram uses rectangle to represent each group (or class) interval.
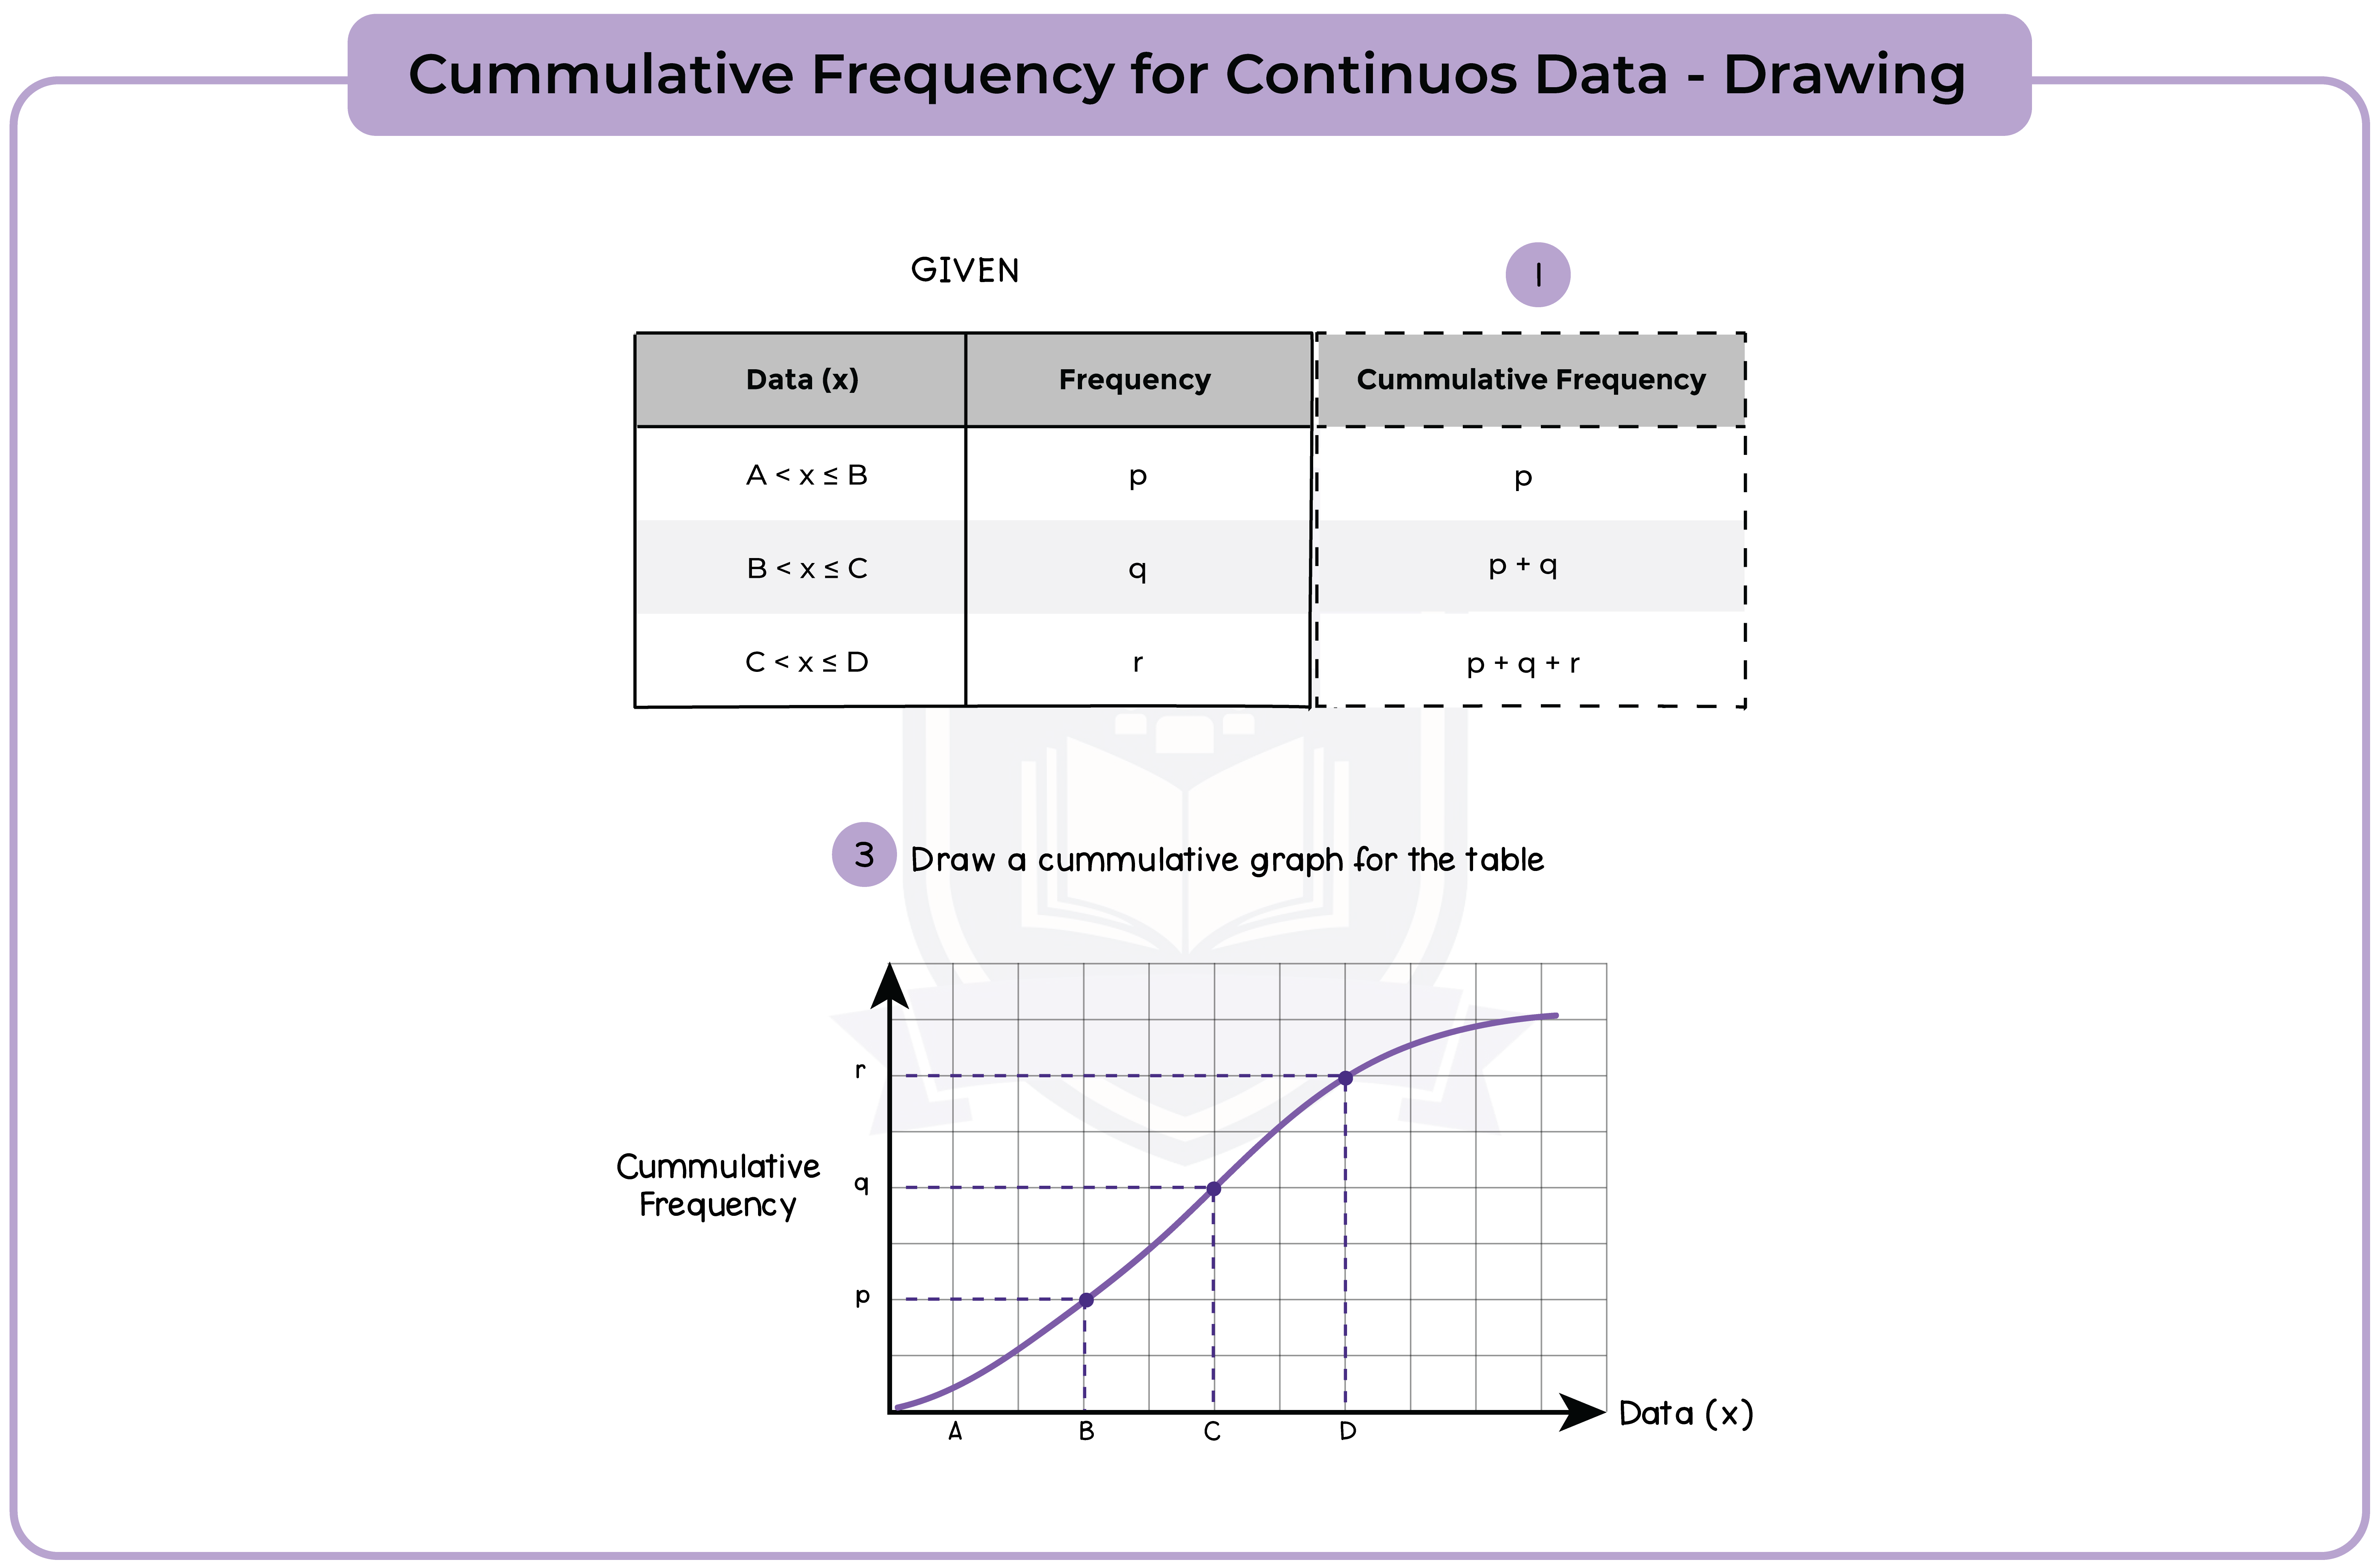
6.1.5 Construct cumulative frequency diagrams from tabulated data (Higher Tier Only)
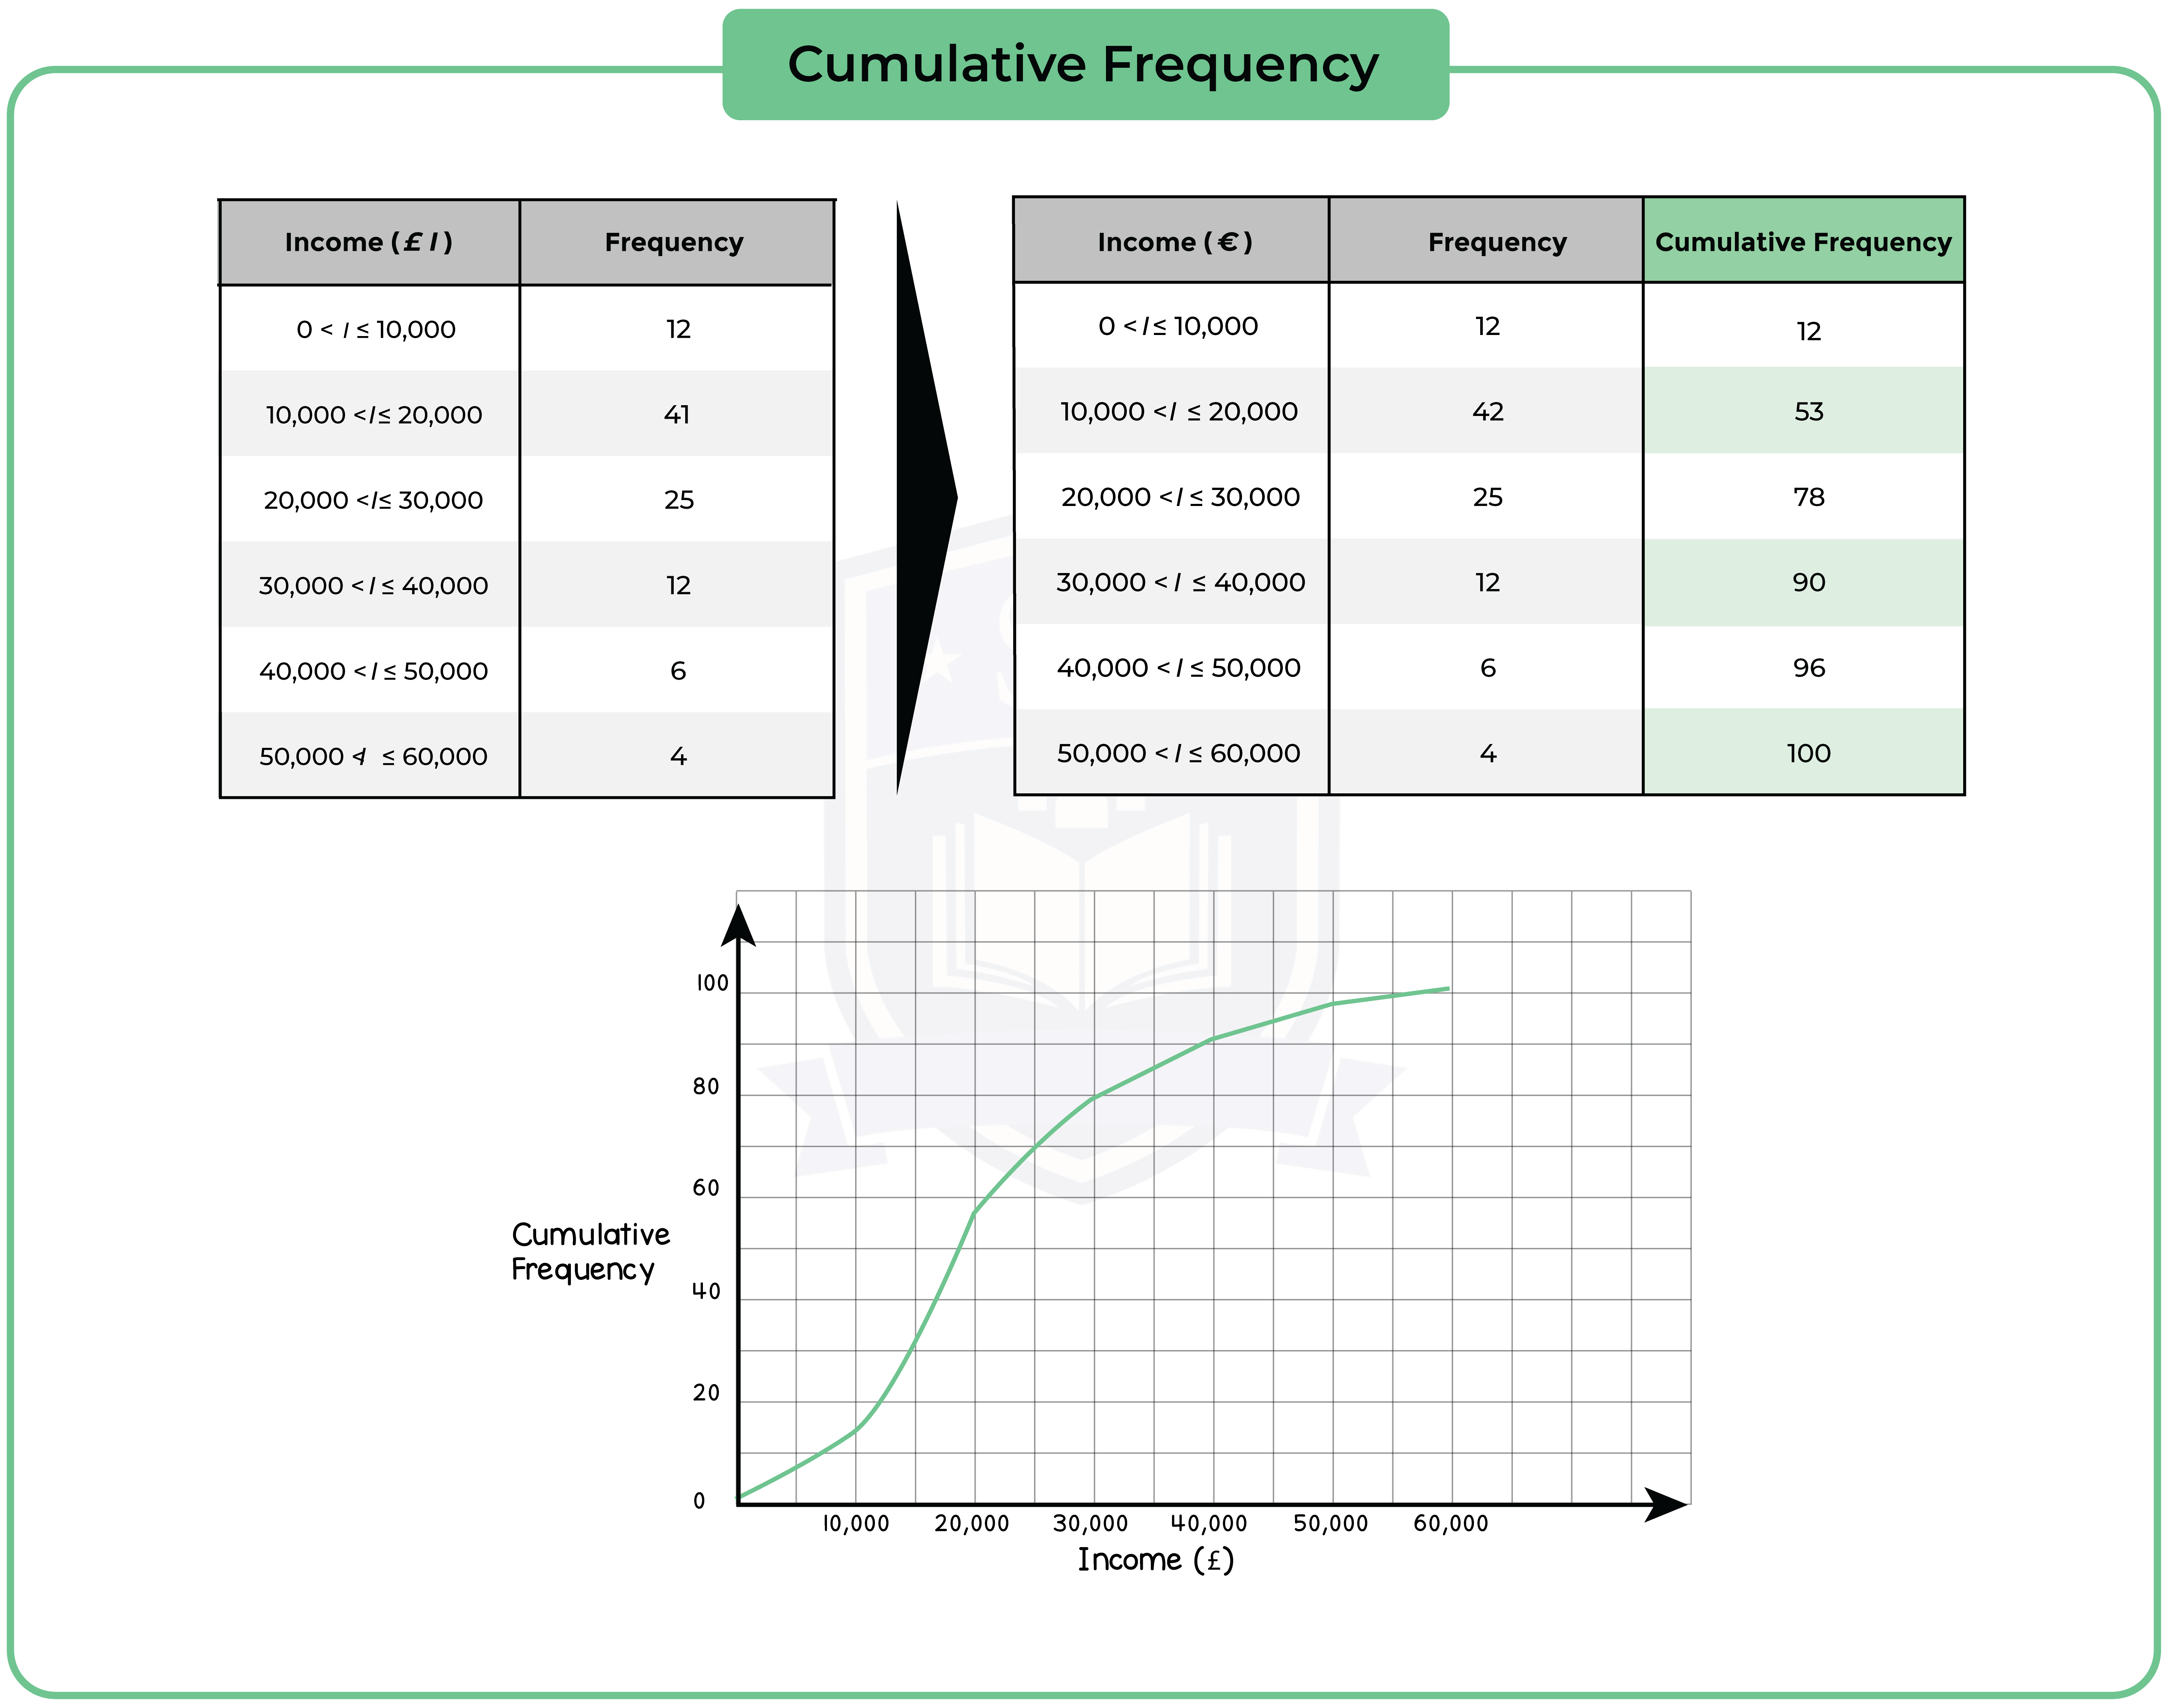
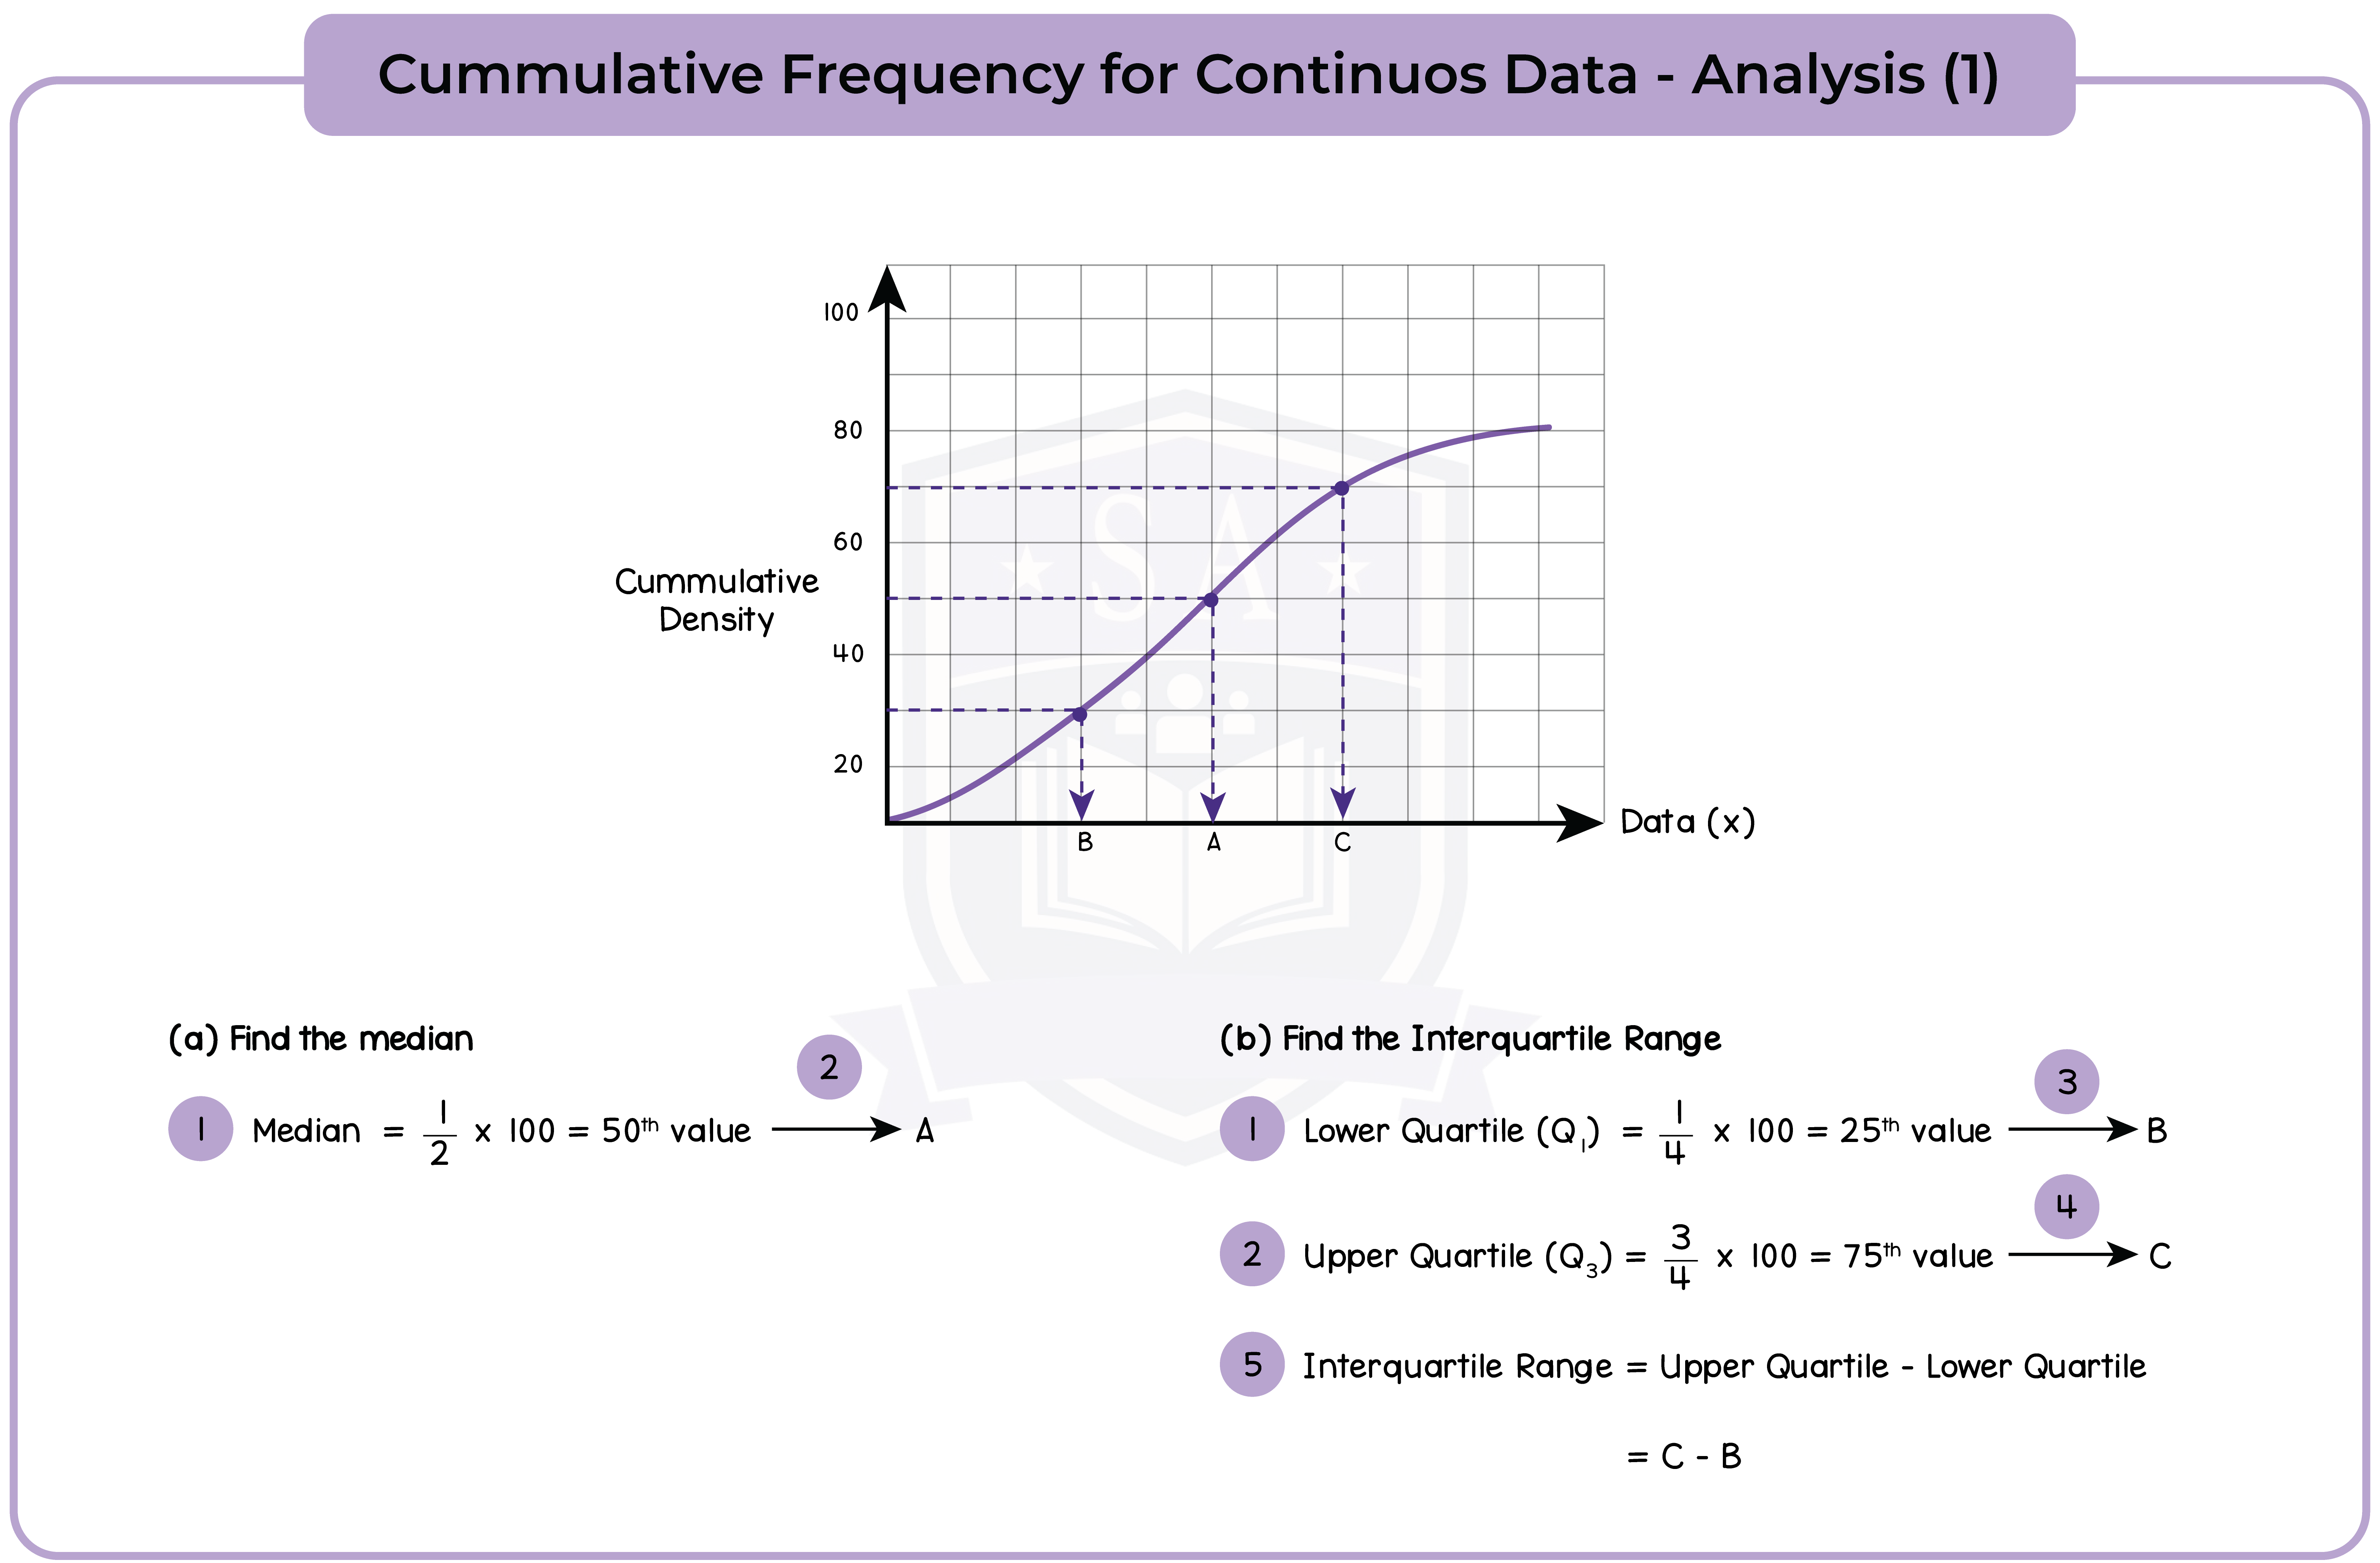
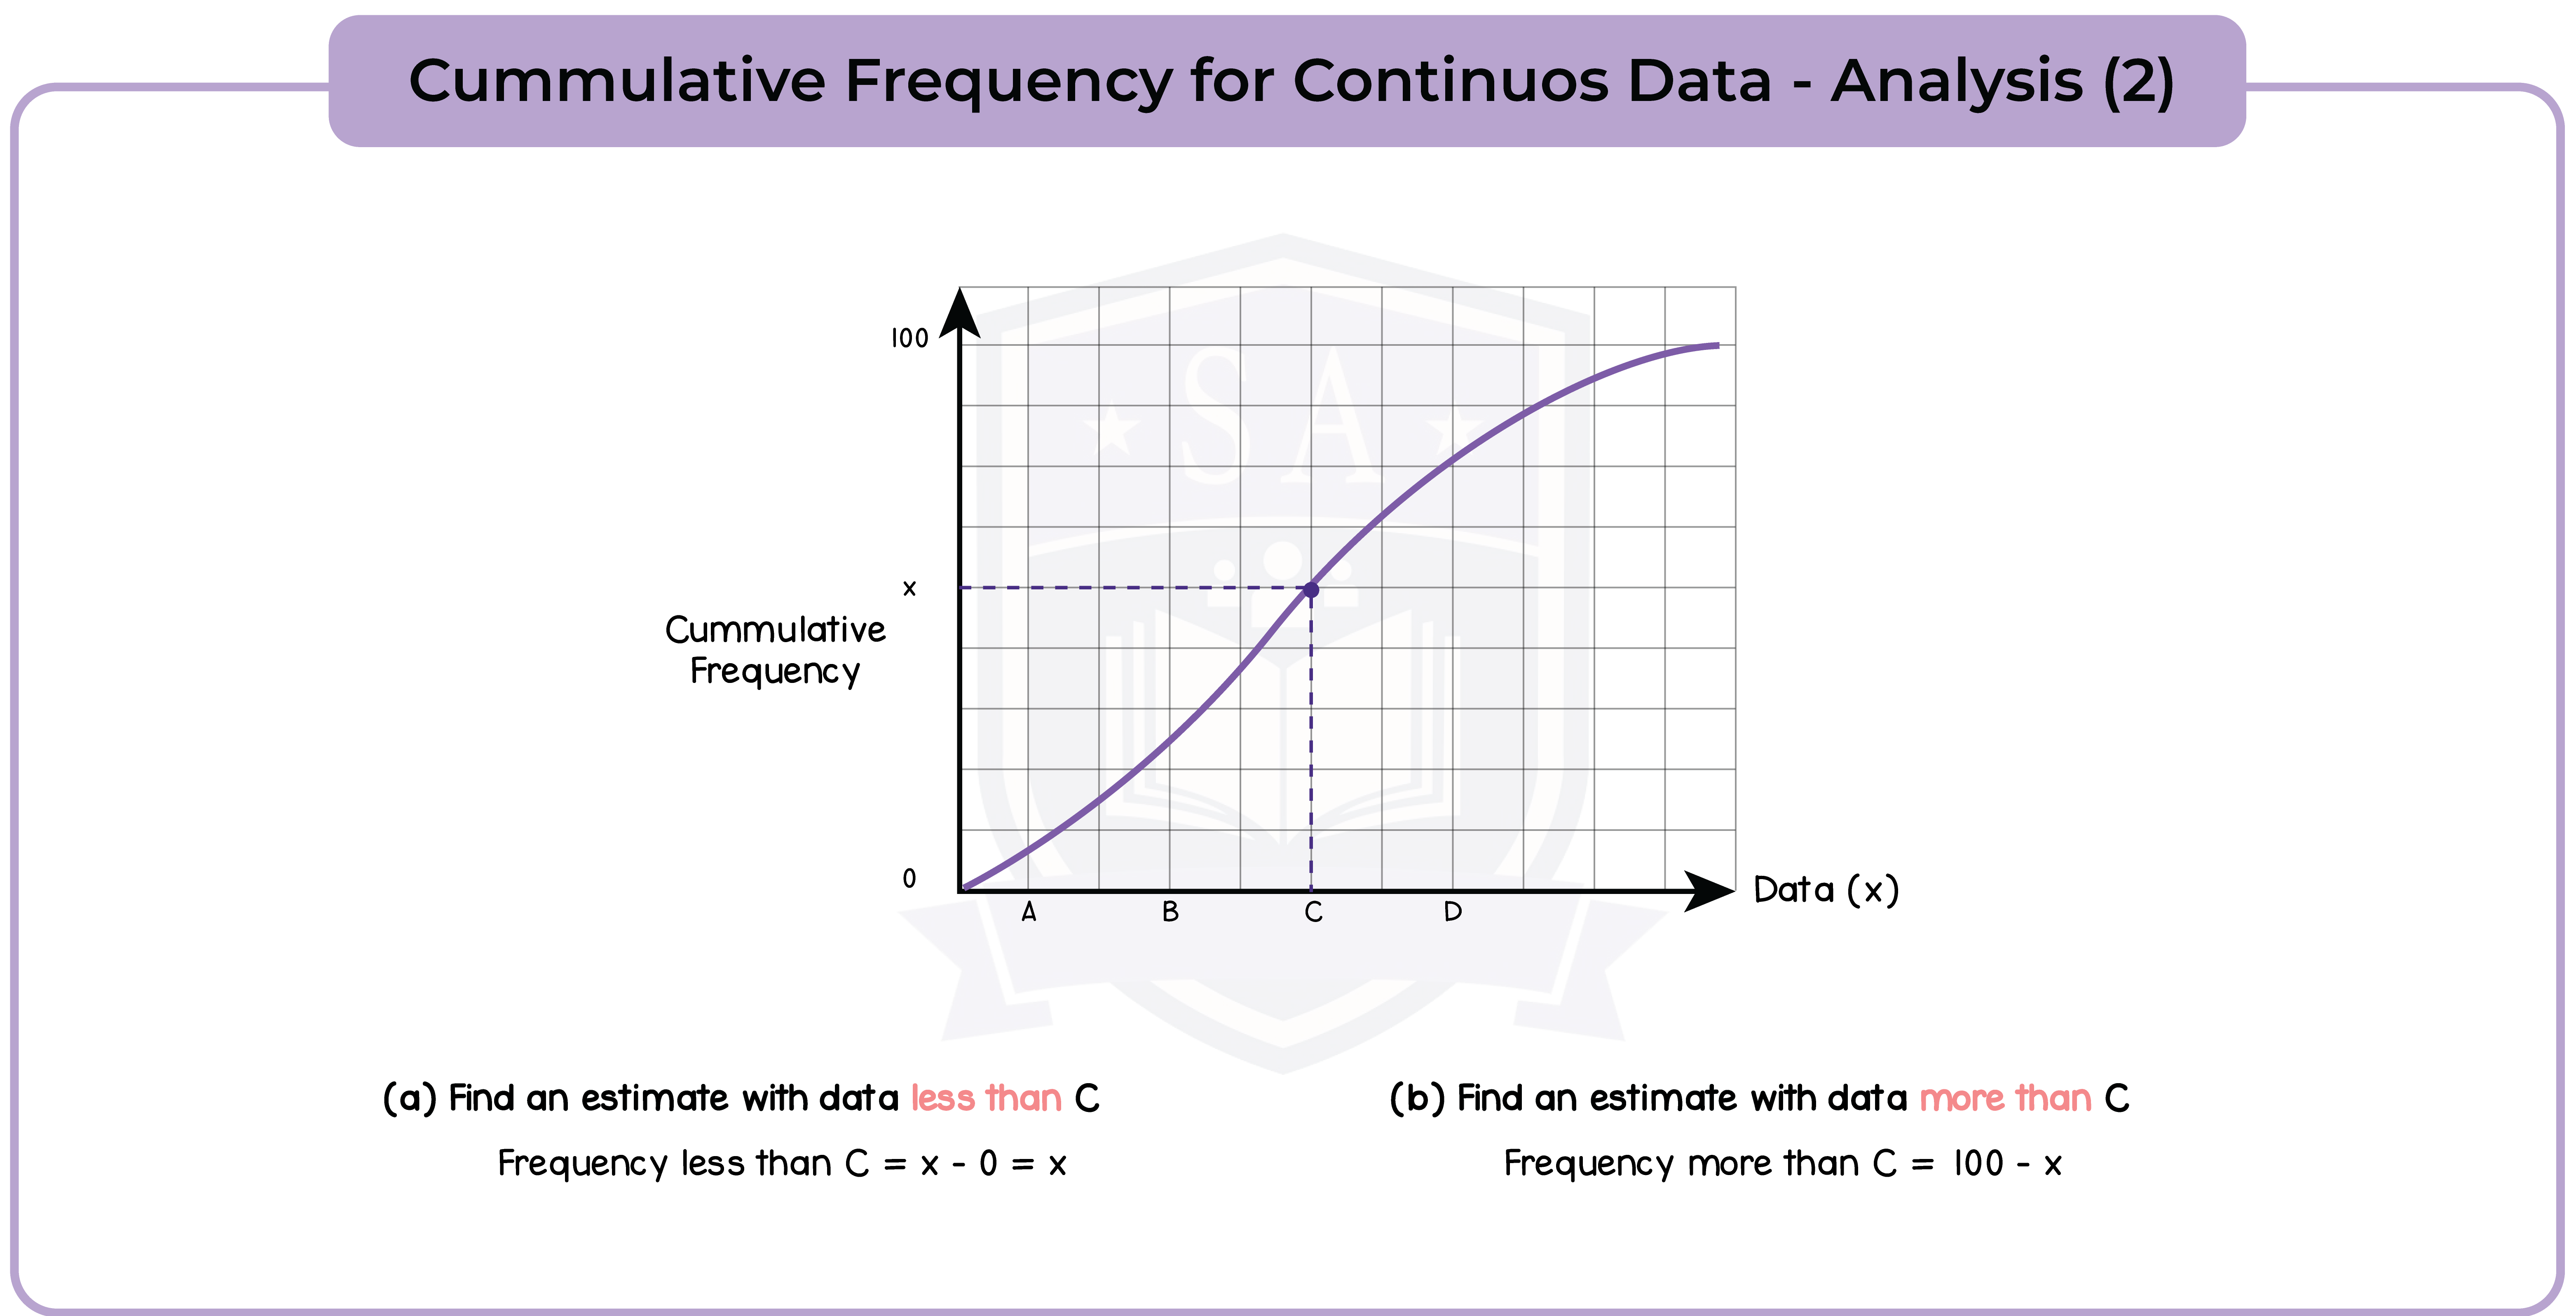
6.1.6 Use cumulative frequency diagrams (Higher Tier Only)


© 2025 Studia Academy. All rights reserved.