Skip to content
  • About
  • Academy
    • Studia School
    • Studia Tutoring
    • Studia Consultation
    Ready to elevate your education?
    Contact us
  • Workshop
  • Care
  • E-Shop
  • Resources
  • Blog
  • Home
  • About
  • Studia School
  • Studia Tutoring
  • Studia Consultation
  • Studia Workshop
  • Studia Care
  • Shop
  • Resources
  • Blog
Platform
Fe-mail Fe-phone Fe-map-pin Fe-instagram
Platform

REVISION NOTES

IGCSE Edexcel Mathematics A

3.3 Graphs

3.3.1 Interpret information presented in a range of linear and non-linear graphs

edexcel_igcse_mathematics a_topic 23_graphs_001_graphs.png

3.3.2 Understand and use conventions for rectangular Cartesian coordinates

3.3.3 Plot points (x, y) in any of the four quadrants or locate points with given coordinates

edexcel_igcse_mathematics a_topic 23_graphs_002_Cartesian Plane
edexcel_igcse_mathematics a_topic 23_graphs_003_Cartesian Coordinate

3.3.4 Determine the coordinates of points identified by geometrical information

3.3.5 Determine the coordinates of the midpoint of a line segment, given the coordinates of the two end points

edexcel_igcse_mathematics a_topic 23_graphs_004_Midpoint

3.3.6 Draw and interpret straight line conversion graphs

Linear functions may be plotted accurately by drawing a table of values.

Although two points are sufficient to define a line, it is customary to plot three points as this helps detect errors caused by a slip in the working.

3.3.7 Find the gradient of a straight line

The gradient of a linear function is defined as the ratio of the height gained to the horizontal distance covered, or ‘rise over run’ for short.

Graphs that go down as you move to the right will have negative gradient.

edexcel_igcse_mathematics a_topic 23_graphs_005_Gradient of Linear Graph

3.3.8 Recognise that equations of the form y = mx + c are straight line graphs with gradient m and intercept on the y-axis at the point (0, c)

A linear graph with gradient m and y intercept c will have equation y = mx + c. This principle allows you to sketch linear functions, and to recognise the equation of a given straight line.

In order to compare the gradient of two linear functions, it is best to rearrange them into the form y= mx + c.

3.3.9 Recognise, generate points and plot graphs of linear and quadratic functions

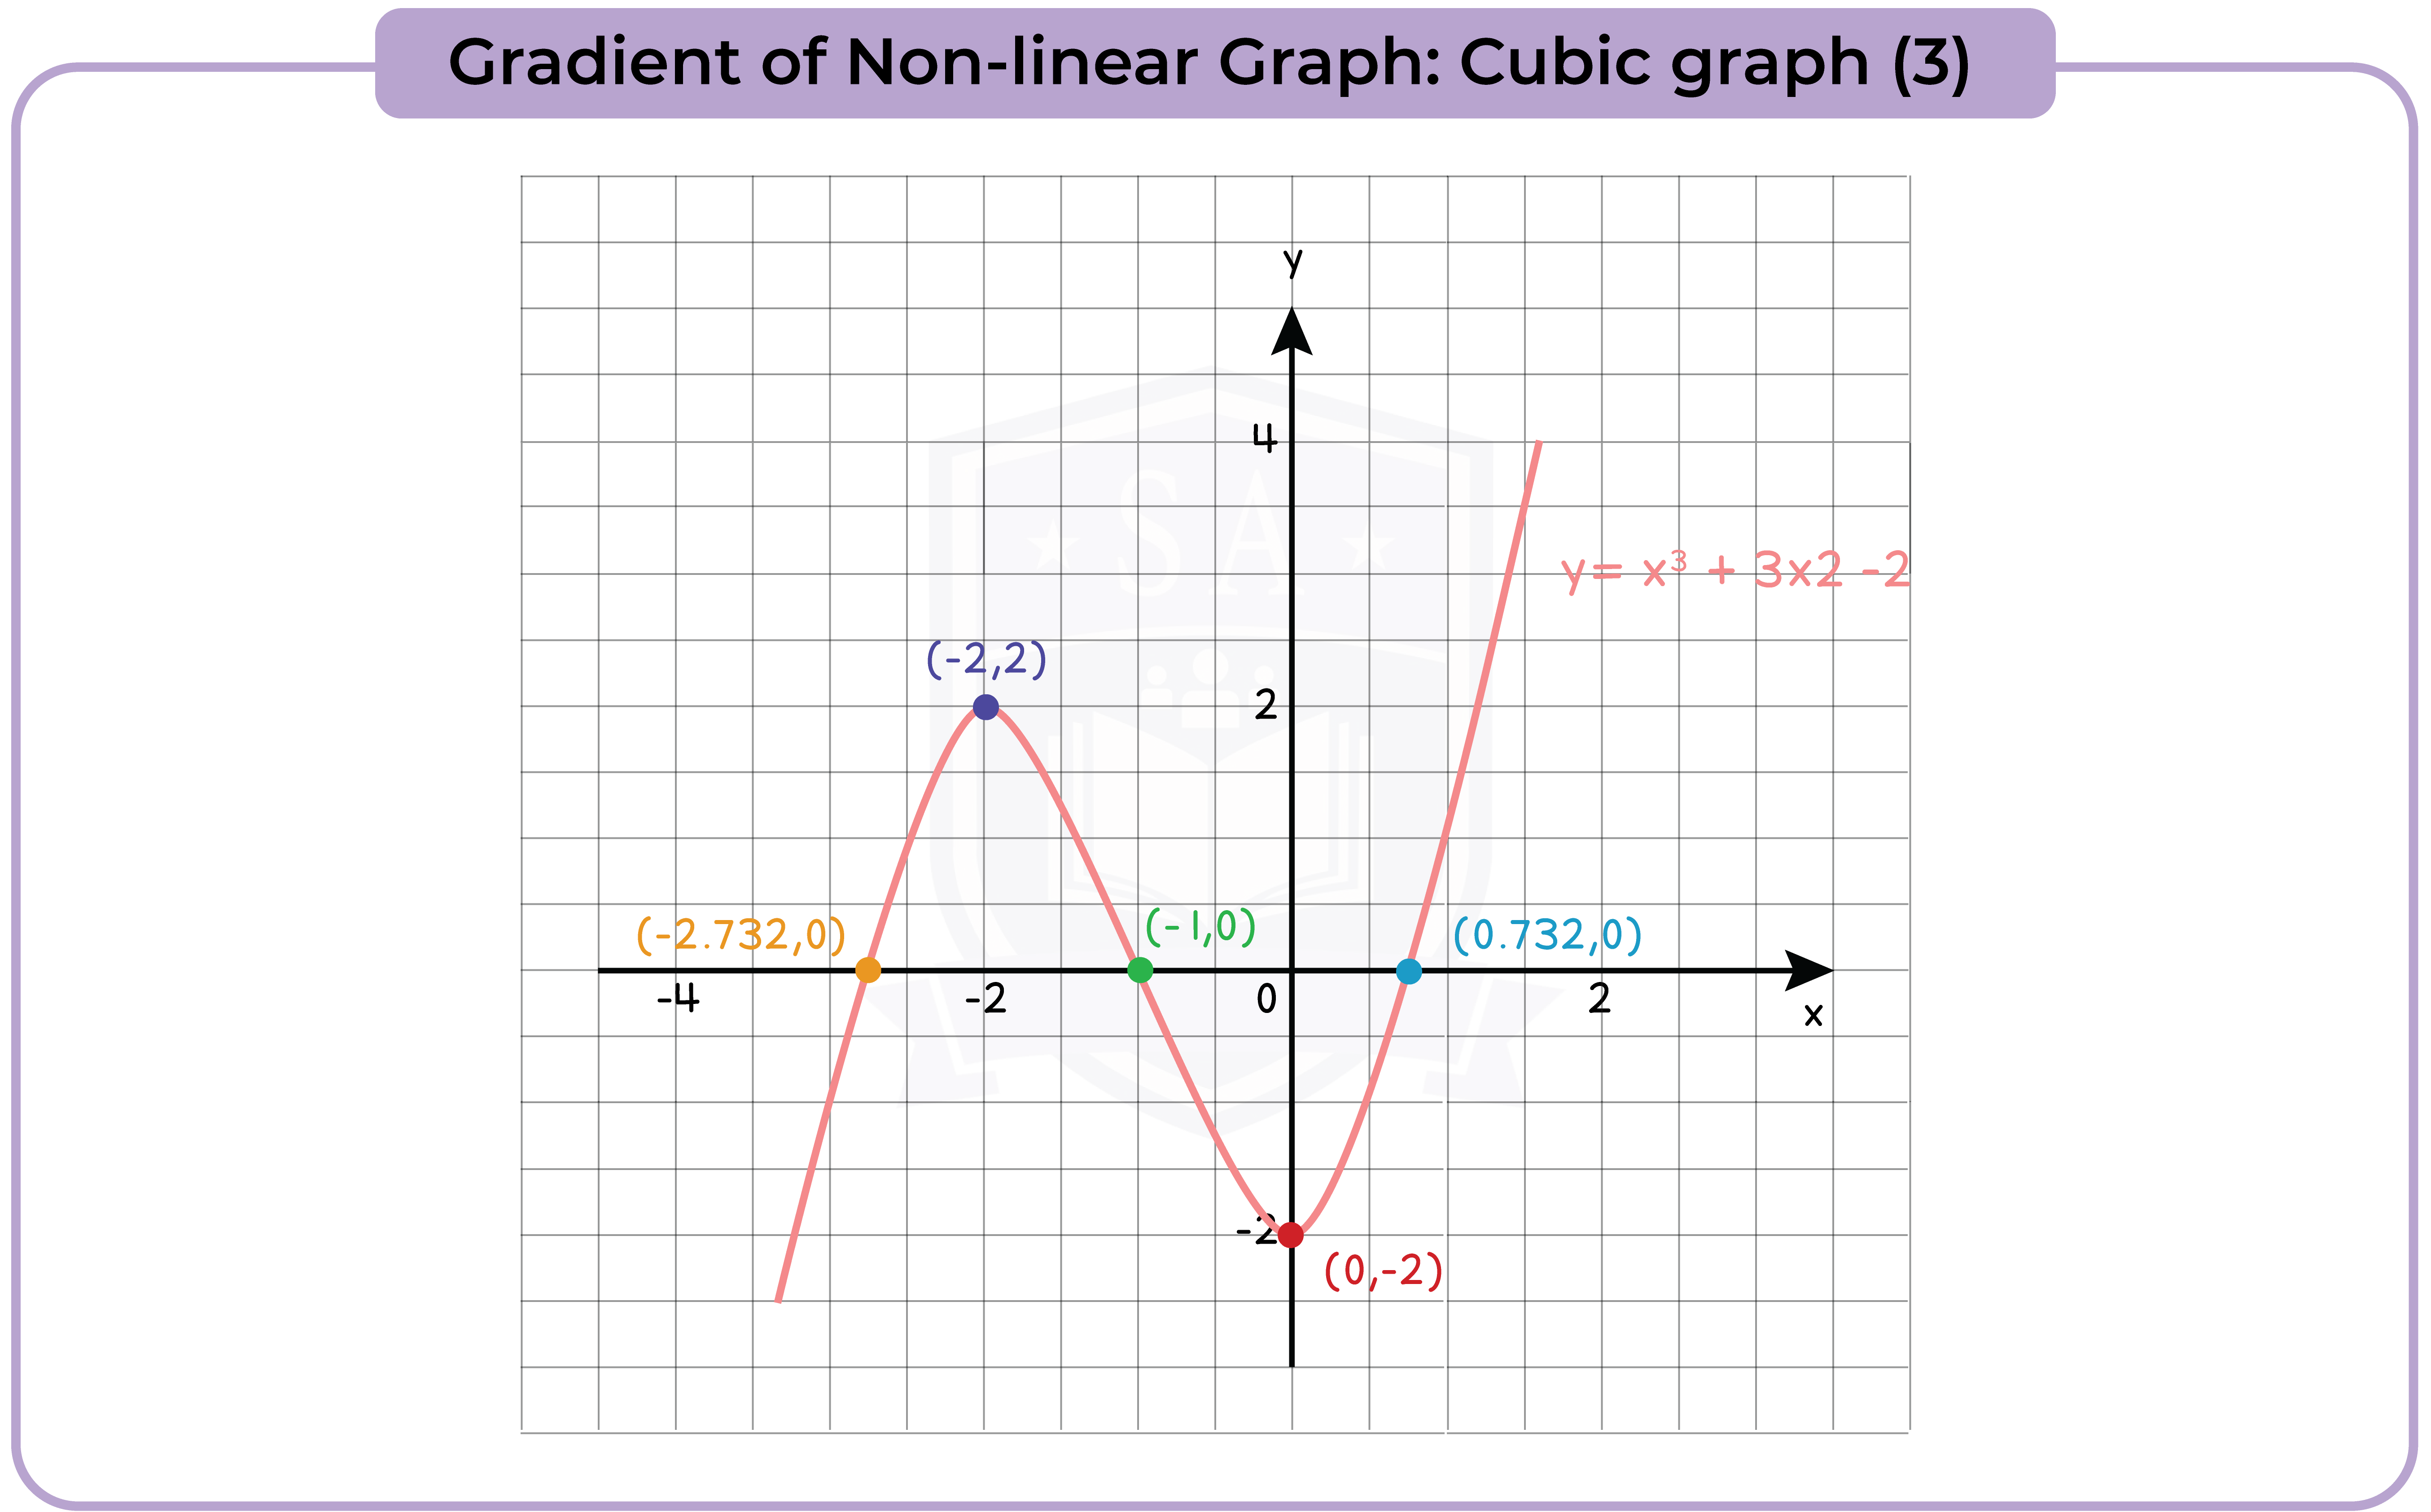
3.3.10 Recognise, plot and draw graphs with equation: (Higher Tier Only)

  • y = Ax3 + Bx2 + Cx + D in which:
    • the constants are integers and some could be zero
    • the letters x and y can be replaced with any other two letters
  • y = Ax3 + Bx2 + Cx + D + +
    • the constants are numerical and at least three of them are zero
    • the letters x and y can be replaced with any other two letters
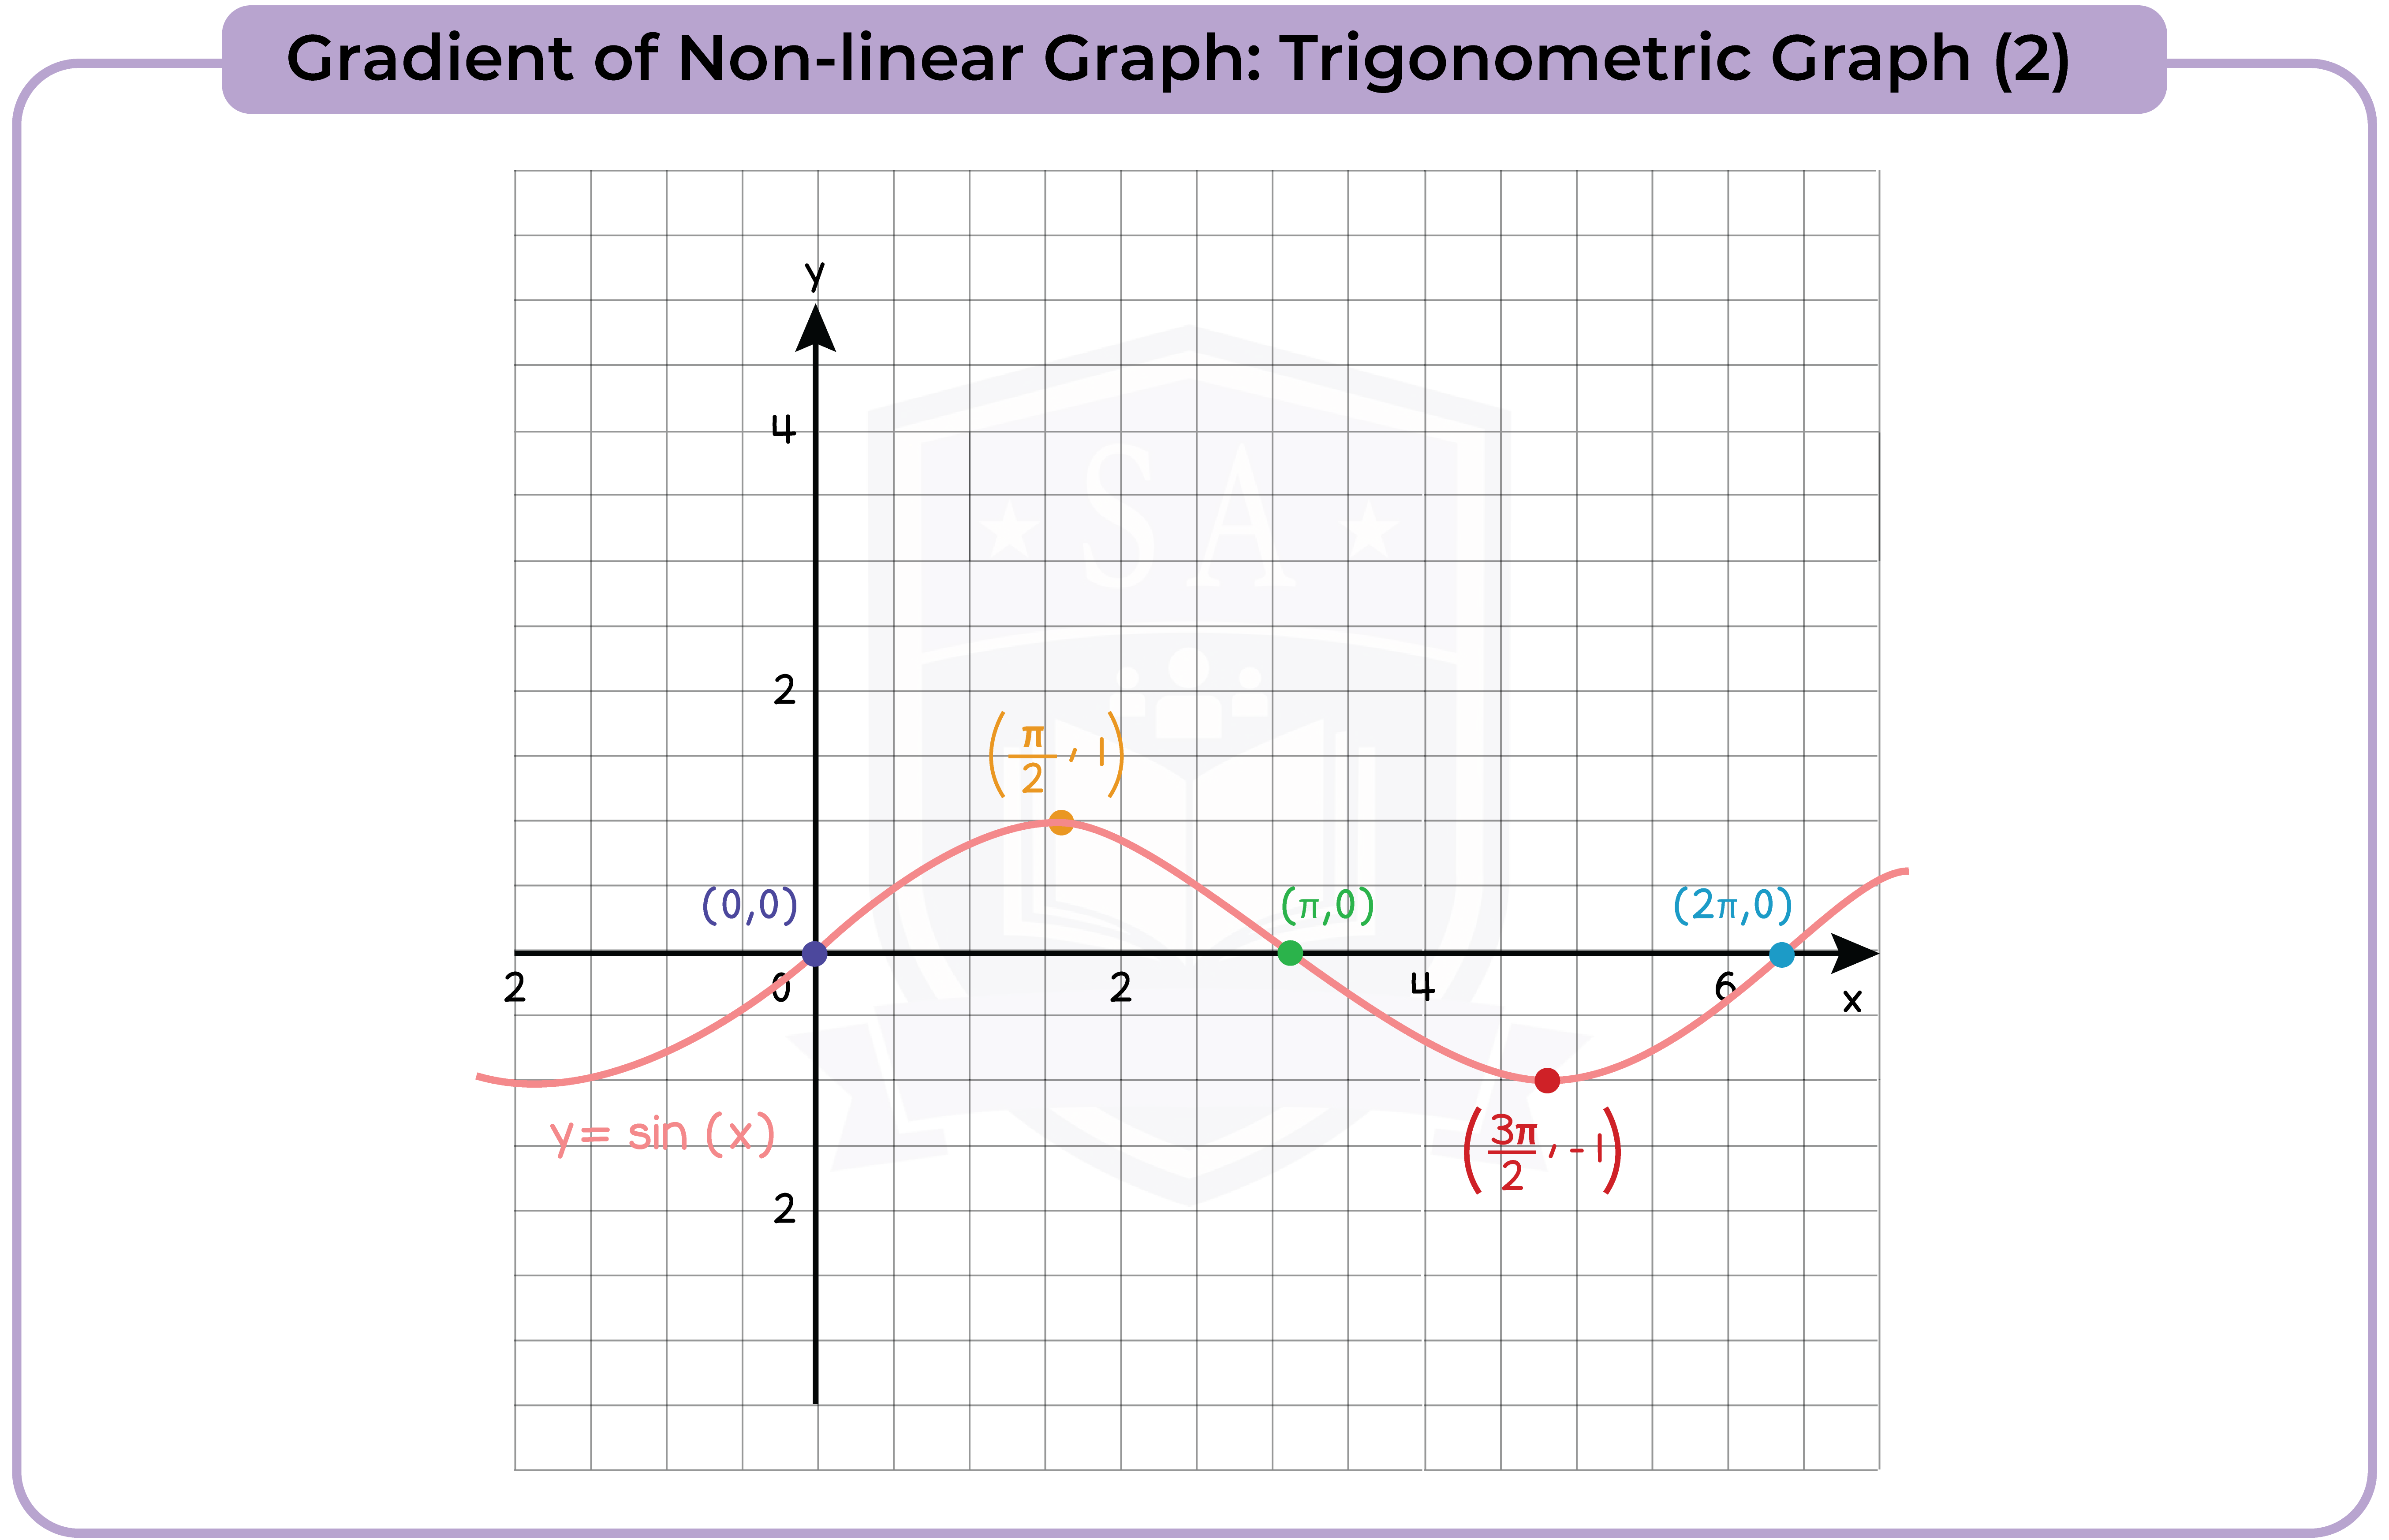
  • y = sin x, y = cos x, y = tan x for angles of any size (in degrees)
edexcel_igcse_mathematics a_topic 23_graphs_006_Trigonometry

3.3.11 Apply to the graph of y = f(x) the transformations y = f(x) + a, y = f(ax), y = f(x + a), y = af(x) for linear, quadratic, sine and cosine functions (Higher Tier Only)

edexcel_igcse_mathematics a_topic 23_graphs_007_Transformation: Horizontal Translation (1)
edexcel_igcse_mathematics a_topic 23_graphs_009_Transformation: Vertical Translation (2)
edexcel_igcse_mathematics a_topic 23_graphs_016_Transformation: Vertical Enlargement(5)
edexcel_igcse_mathematics a_topic 23_graphs_019_Drawing Graph Translation
edexcel_igcse_mathematics a_topic 23_graphs_017_Transformation: Summary
edexcel_igcse_mathematics a_topic 23_graphs_020_Drawing Graph Stretches
edexcel_igcse_mathematics a_topic 23_graphs_021_Drawing Graph Reflection
edexcel_igcse_mathematics a_topic 23_graphs_022_Analysing Graph Transformation

3.3.12 Interpret and analyse transformations of functions and write the functions algebraically (Higher Tier Only)

edexcel_igcse_mathematics a_topic 23_graphs_007_Transformation: Horizontal Translation (1)
edexcel_igcse_mathematics a_topic 23_graphs_011_Transformation: Reflection in the x-axis (3)
edexcel_igcse_mathematics a_topic 23_graphs_012_Transformation: Reflection in the y-axis (4)
edexcel_igcse_mathematics a_topic 23_graphs_013_Transformation: Enlargement (5)
edexcel_igcse_mathematics a_topic 23_graphs_015_Transformation: Enlargement (5)
edexcel_igcse_mathematics a_topic 23_graphs_018_Graph Transformation

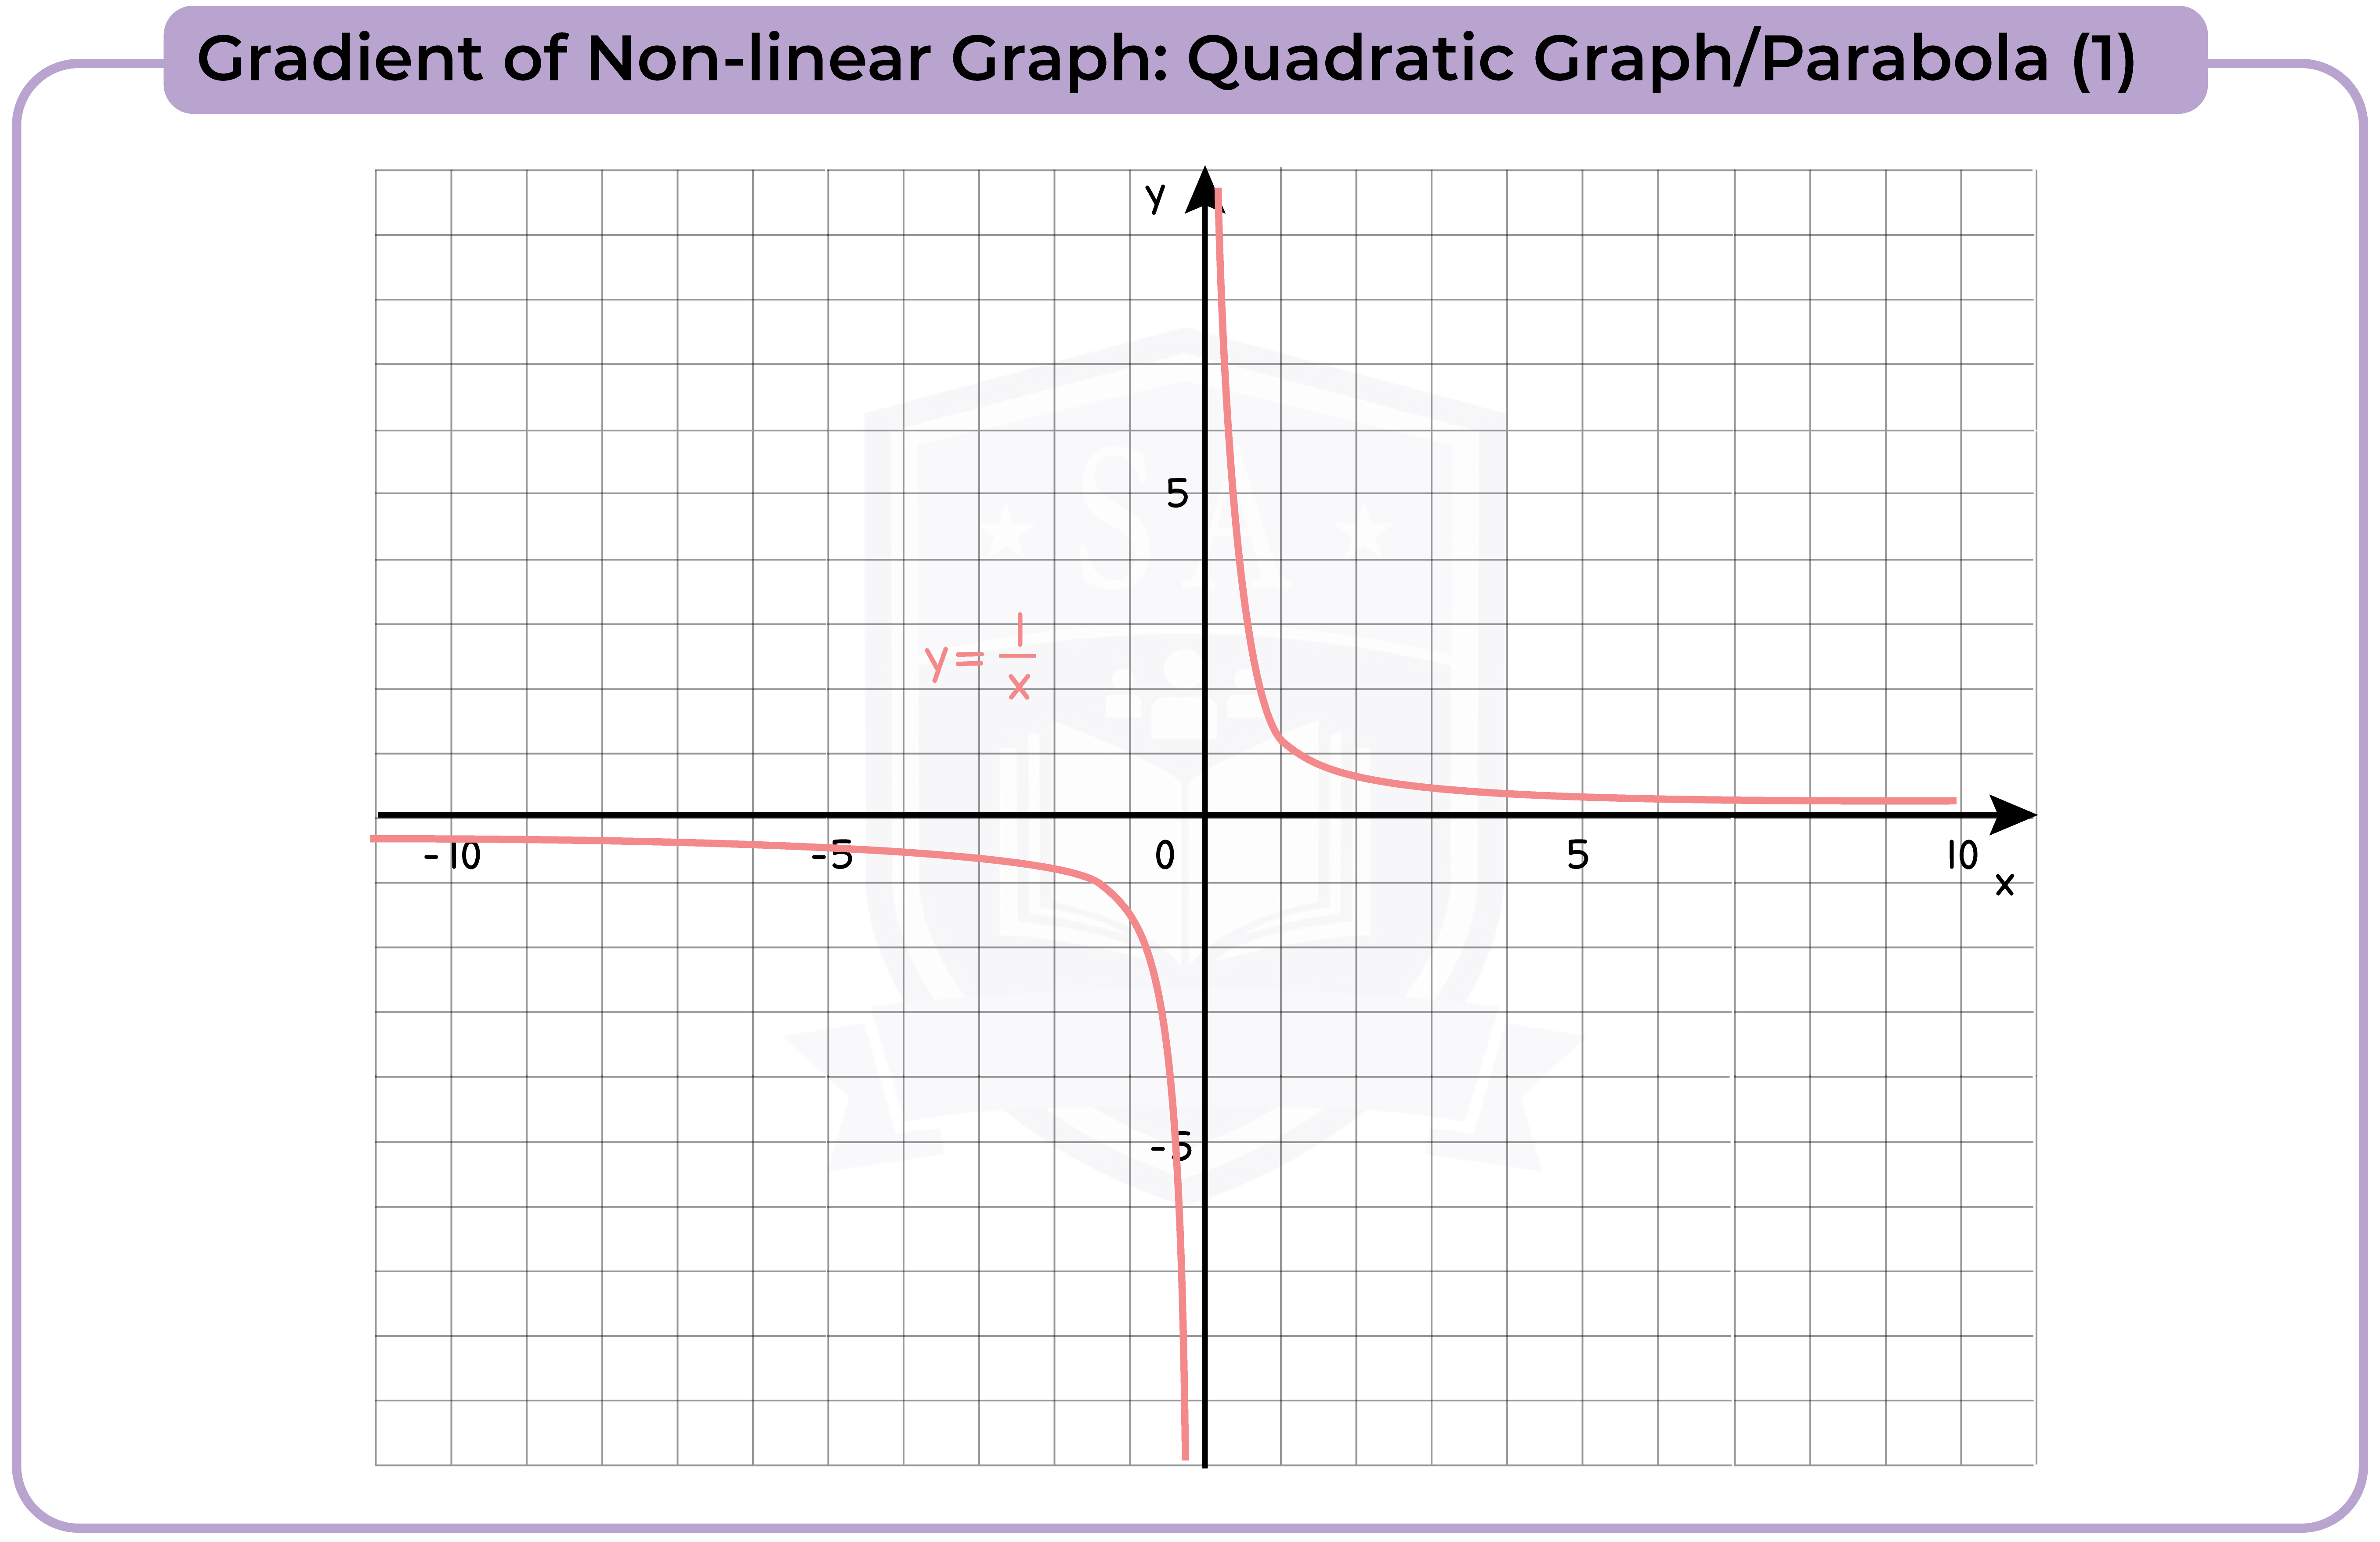
3.3.13 Find the gradients of non-linear graphs (Higher Tier Only)

edexcel_igcse_mathematics a_topic 23_graphs_023_Gradient of Non-linear Graph: Quadratic Graph/Parabola (1)
edexcel_igcse_mathematics a_topic 23_graphs_025_Gradient of Non-linear Graph: Trigonometric Graph (2)
edexcel_igcse_mathematics a_topic 23_graphs_024_Gradient of Non-linear Graph: Cubic graph (3)
edexcel_igcse_mathematics a_topic 23_graphs_026_Gradient of Non-linear Graph: Quadratic Graph/Parabola (1)

3.3.14 Find the intersection points of two graphs, on linear (y1) and one non-linear (y2), and recognise that the solutions correspond to the solutions of (y2 – y1) = 0 (Higher Tier Only)

3.3.15 Calculate the gradient of a straight line given the coordinates of two points (Higher Tier Only)

3.3.16 Find the equation of a straight line parallel to a given line; find the equation of a straight line perpendicular to a given line (Higher Tier Only)

Back
Next
1. Numbers & the Number System

1.1 Integers

1.2 Fractions

1.3 Decimals

1.4 Powers and Roots

1.5 Set Language and Notation

1.6 Percentages

1.7 Ratio and Proportion

1.8 Degree of Accuracy

1.9 Standard Form

1.10 Applying Numbers

1.11 Electronic Calculator

2. Equations, Formulae & Identities

2.1 Use of Symbols

2.2 Algebraic Manipulation

2.3 Expressions and Formulae

2.4 Linear Equations

2.5 Proportion (Higher Tier Only)

2.6 Simultaneous Linear Equations

2.7 Quadratic Equations

2.8 Inequalities

3. Sequences, Functions & Graphs

3.1 Sequences

3.2 Function Notation (Higher Tier Only)

3.3 Graphs

3.4 Calculus (Higher Tier Only)

4. Geometry

4.1 Angles, Lines & Triangles

4.2 Polygons

4.3 Symmetry

4.4 Measures

4.5 Construction

4.6 Circle Properties

4.7 Geometric Reasoning

4.8 Trigonometry and Pythagoras’ Theorem

4.9 Mensuration of 2D Shapes

4.10 3D Shapes and Volumes

4.11 Similarity

5. Vectors & Transformation Geometry

5.1 Vectors (Higher Tier Only)

5.2 Transformation Geometry

6. Statistics & Probability

6.1 Graphical Representation of Data

6.2 Statistical Measures

6.3 Probability

7. Appendix

7.1 Appendix 1: Foundation Tier Formula Sheet (Given)

7.2 Appendix 2: Foundation Tier Formula Sheet (To Memorise)

7.3 Appendix 3: Higher Tier Formula Sheet (Given)

7.4 Appendix 4: Higher Tier Formula Sheet (To Memorise)

7.5 Appendix 5: Notation

Start Your Success Story Today

  • enquiries@studiaacademy.com
  • (+852) 5487 8448
  • 1201B, Tower 1, Admiralty Center,

    18 Harcourt Road, Admiralty, Hong Kong
  • studiaacademy
  • studiaeshop
  • About Studia
  • Getting to Studia
  • Studia School
  • Studia Tutoring
  • Studia Consultation
  • Studia Workshop
  • Studia Care
  • Studia Shop
  • Studia Resources
  • Studia Blog
  • Studia Platform

© 2025 Studia Academy. All rights reserved.

  • Terms of Use
  • Privacy Policy

Contact Studia

Please fill out the form below, and we’ll get back to you as soon as possible.