REVISION NOTES
1.1.1 Understand the three states of matter in terms of the arrangement, movement and energy of the particles
")
")
1.1.2 Understand the interconversions between the three states of matter in terms of:
Interconversion between different states of matter is a physical change
From solid to liquid to gas (left to right):
From gas to liquid to solid (right to left):
When there is a change in state, the temperature does not change
1.1.3 Understand how the results of experiments involving the dilution of coloured solutions and diffusion of gases can be explained
DIFFUSION
Both diffusion and dilution support the theory that:
Experiment 1: Diffusion in Gas
Observation
Explanation
Experiment 2: Diffusion in Liquid
Observation
Explanation
Experiment 3: Dilution
Dilution, together with diffusion, is one of the experiments which support the theory that: all matter is made up of tiny, moving particles.
Observation
Explanation
1.1.4 Know what is meant by the terms:
1.1.5C Know what is meant by the term solubility in the units g per 100 g of solvent
SOLUBIILITY
Solubility of solids depend on temperature:
Solubility of gases depend on both temperature and pressure:
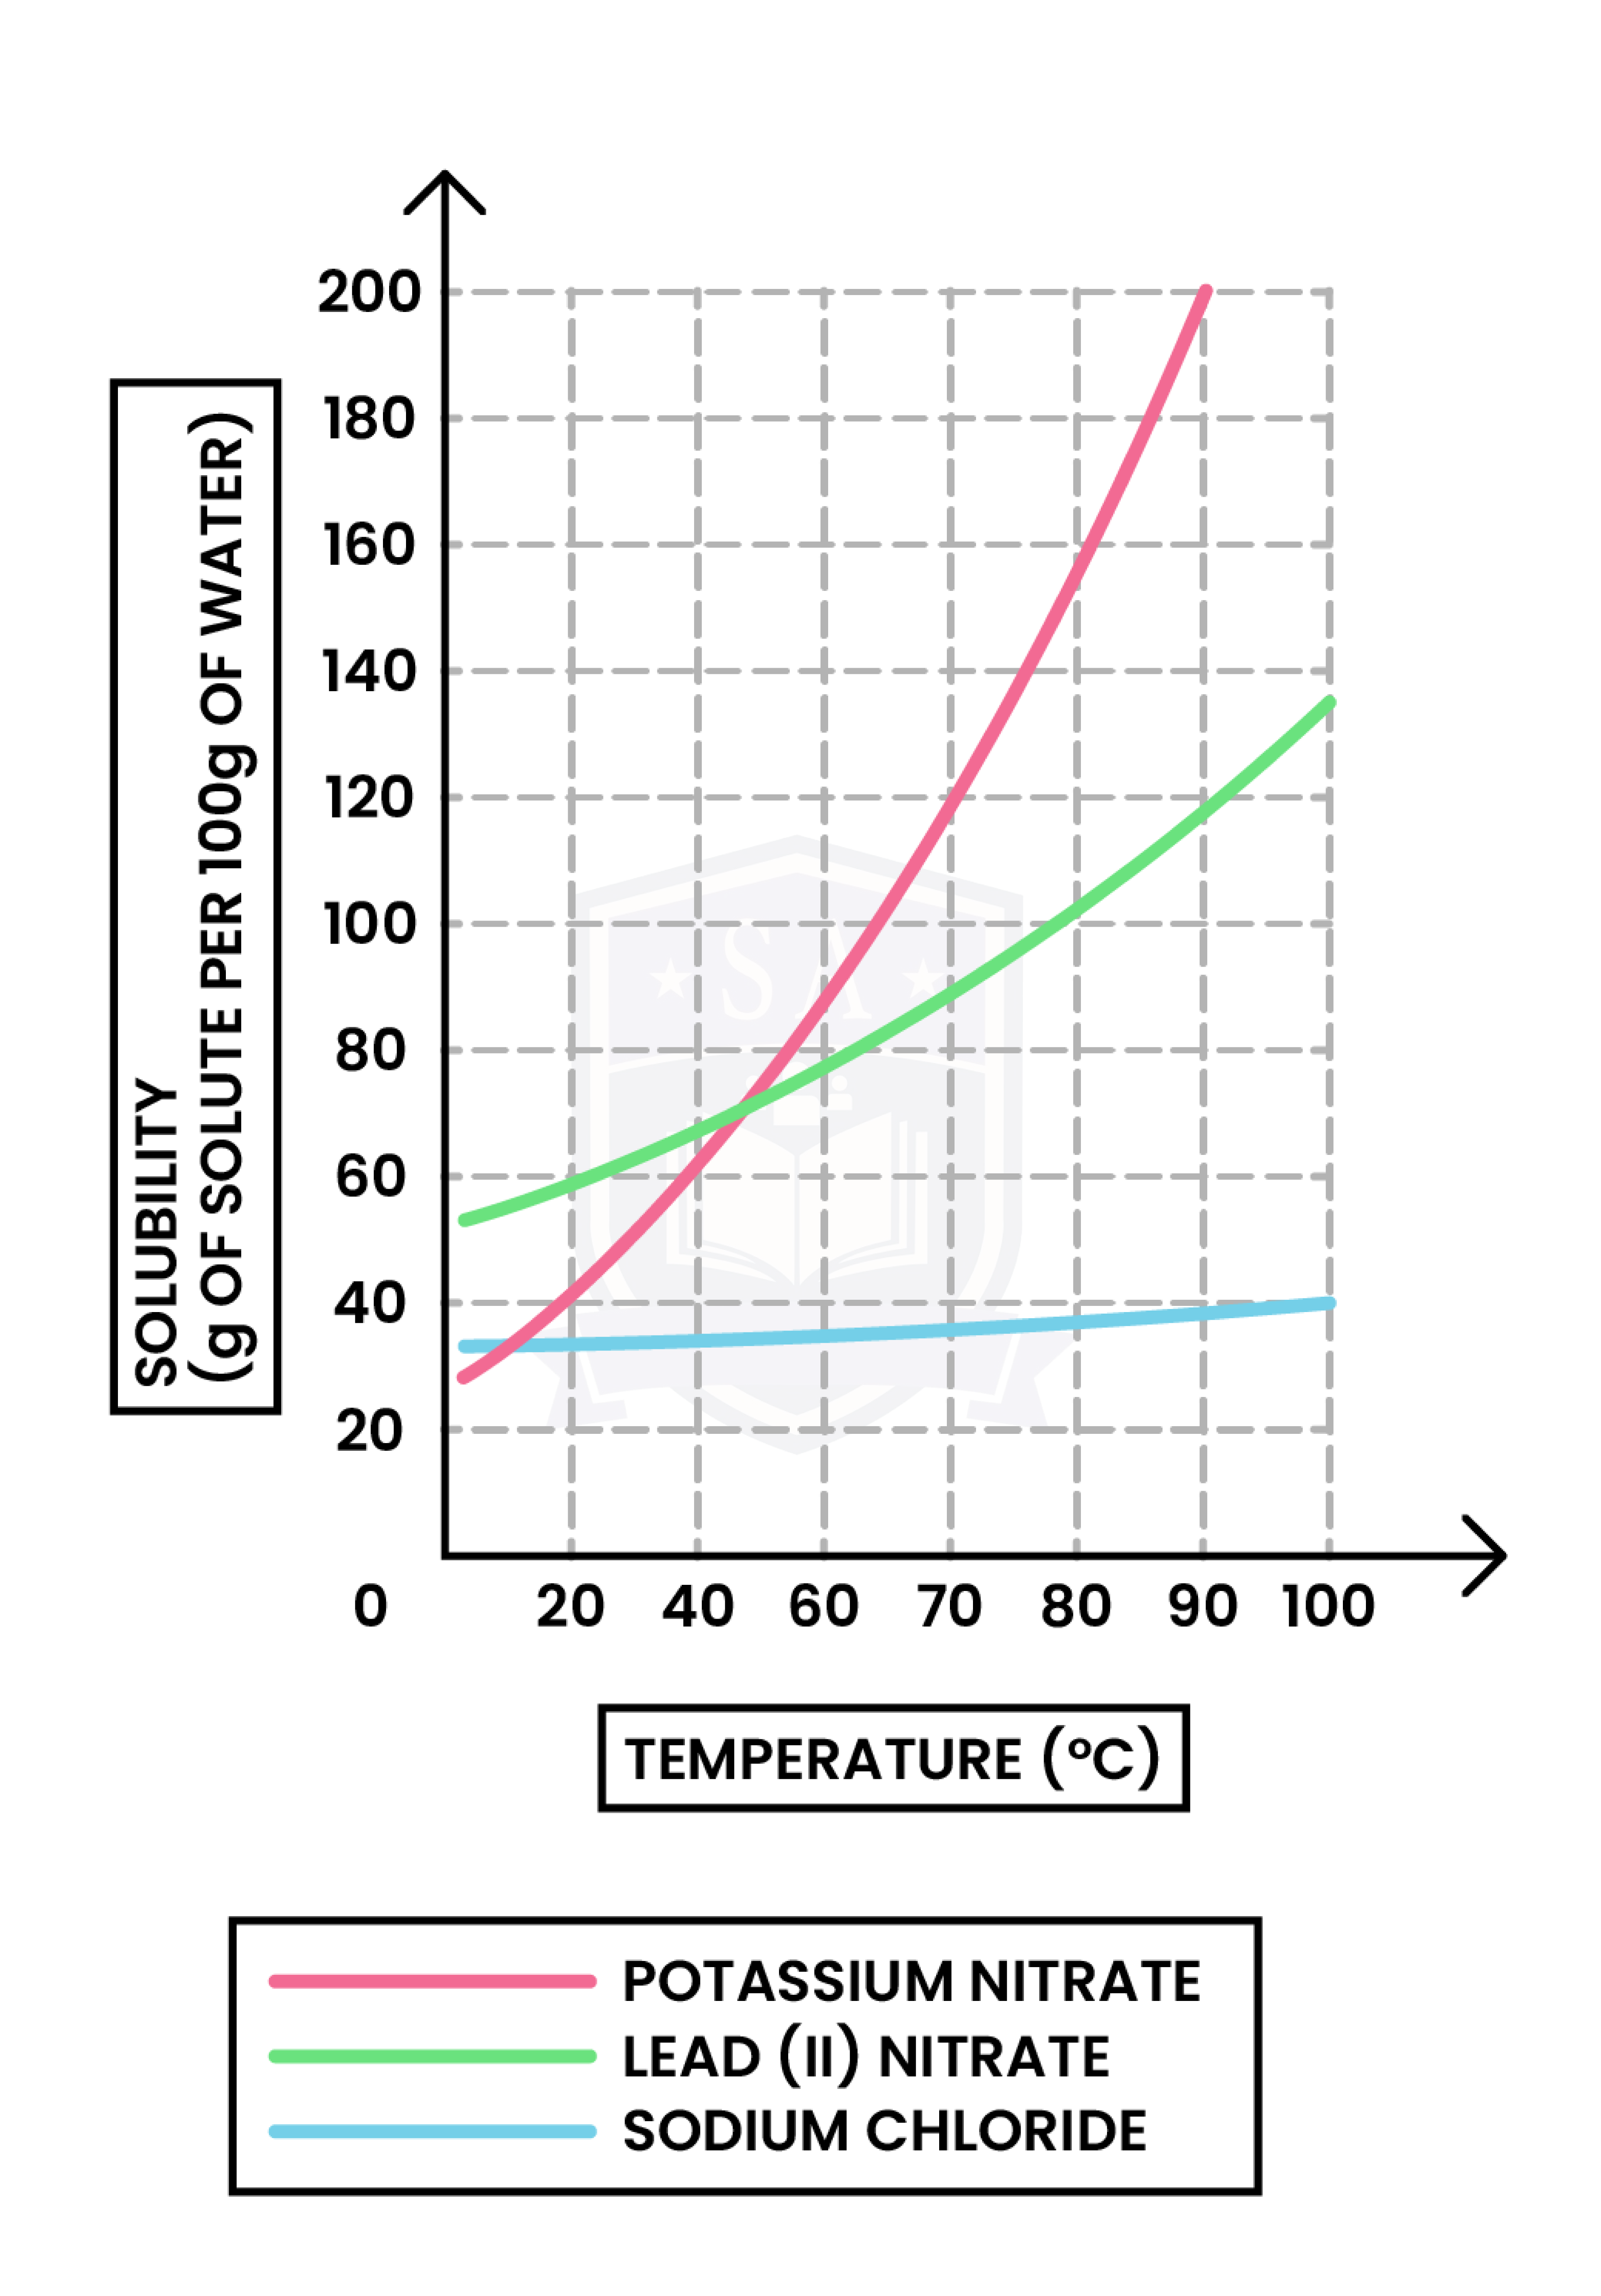
1.1.6C Understand how to plot and interpret solubility curves
x-axis: Temperature (in oC or Kelvin)
y-axis: Solubility (in g per 100g of water)
To plot a solubility curve:
Always remember:
1.1.7C Practical: investigate the solubility of a solid in water at a specific temperature
AIM
EQUIPMENT LIST
CHEMICALS REQUIRED
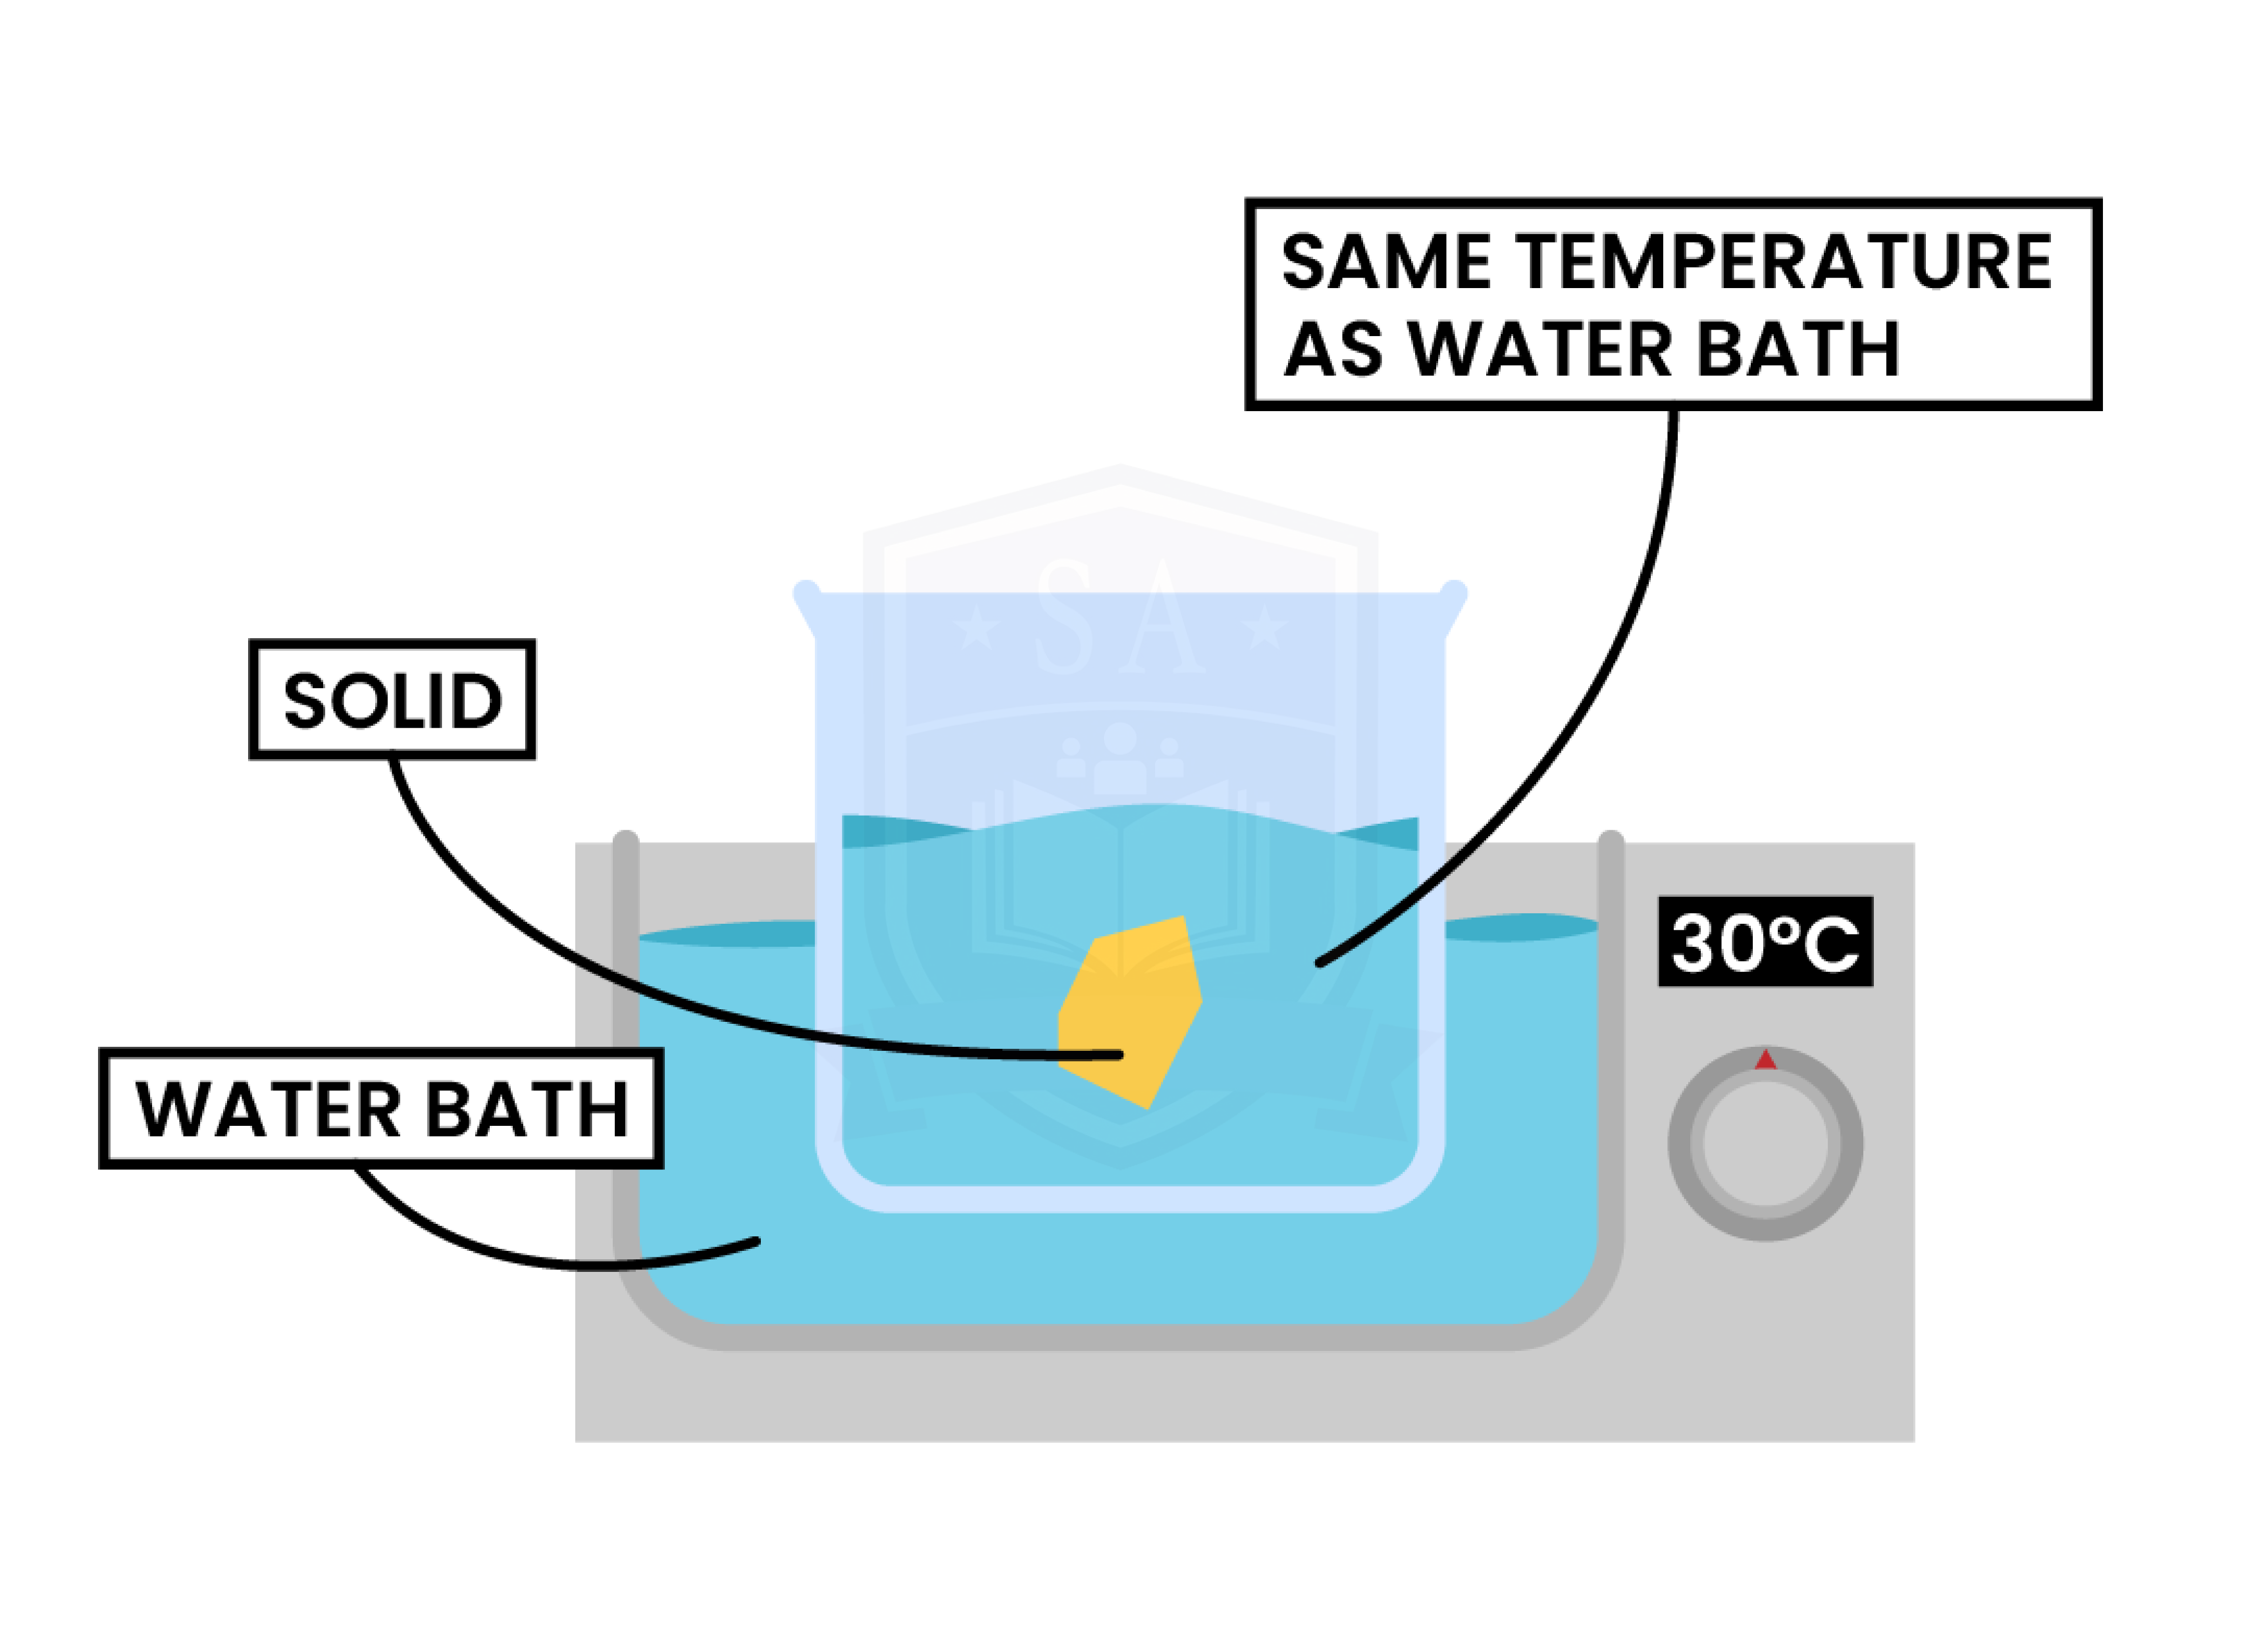
METHOD
KEY POINTS
SAFETY PRECAUTIONS
Result Table
RESULT GRAPH


© 2025 Studia Academy. All rights reserved.